
How to suppress missing values in charts
9 March, 2015
Hi Team ,
Please let us know how to suppress missing values in charts.
Currently in a multi dimension chart , if values are not present for a particular dimesnion value , its getting plotted at 0 . How to supress these values in Cross tab reports.
PFA the screenshot for the chart in which we want to supress zero/missing values
Hello,
I found this Forum post regarding null-values and charts for your review.
Missing Values
Please let us know if this helps.
Thank you,
Kyle
I found this Forum post regarding null-values and charts for your review.
Missing Values
Please let us know if this helps.
Thank you,
Kyle
Hi Kyle ,
We wanted to supress null in metrics . The above example is to supress Null in dimensions..
In the attachment for year 2014 ,for several months the metric is null . But still since its a cross tab , its showing zeros for those months in the graph.
We want to supress those zero values . Please let us know how can we achieve this
Thanks,
Sanjay
Hi Sanjay,
What you're after is definitely possible.
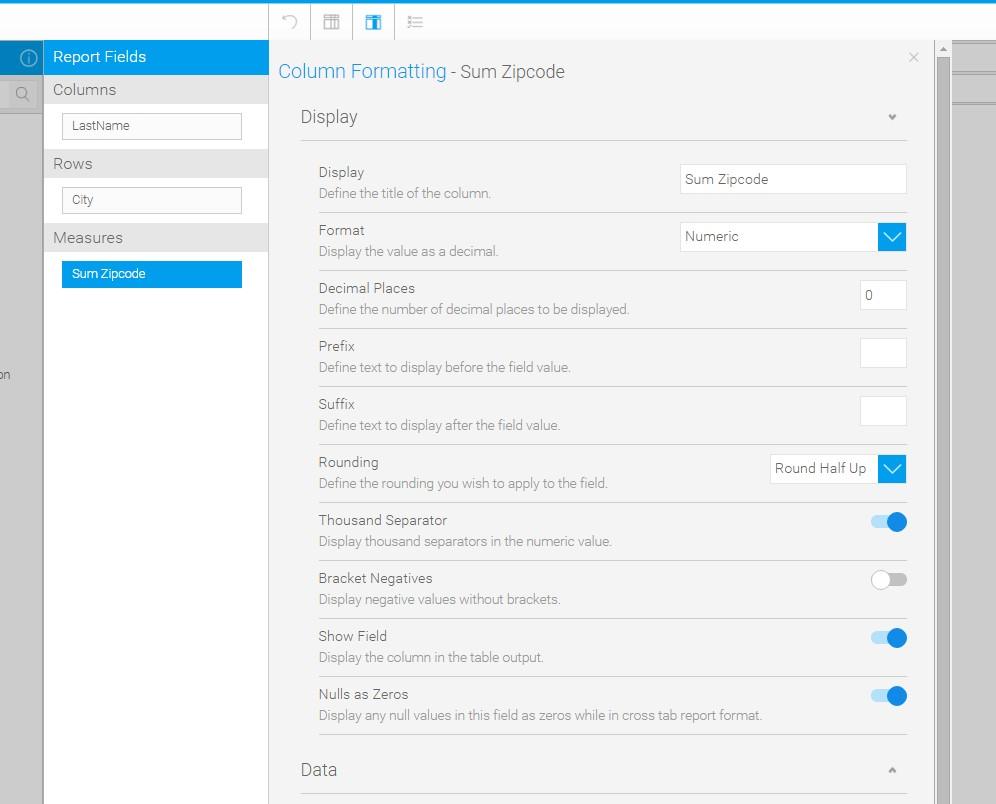
You just need to disable the 'Nulls as Zeros' option on the column formatting for your measure.
E.g.

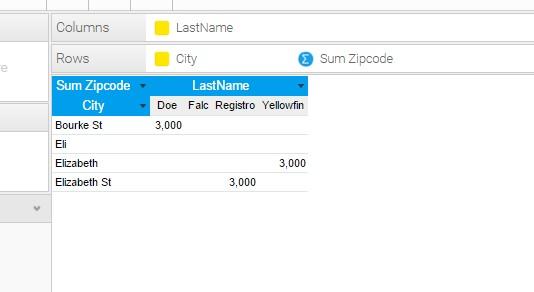
You will then end up with a cross-tab that shows nulls, rather than 0s.
Please let me know if this doesn't give you what you were after.
Regards,
David
What you're after is definitely possible.
You just need to disable the 'Nulls as Zeros' option on the column formatting for your measure.
E.g.
You will then end up with a cross-tab that shows nulls, rather than 0s.
Please let me know if this doesn't give you what you were after.
Regards,
David