
Multiple charts in report: not showing new ones
5 January, 2015
I'm facing the following problem: I've created a report, with a table and 2 charts.
So far so good; after I saved and used the report, I've created 2 more charts in this existing report. However, the newly created charts are not displayed when I view the output or when the report is activated. How to solve this?
Also, I can't find out how to set the order of the charts; how they are displayed in the report. For example, I have 1. line-chart, 2. area-chart, 3. pie-chart. How to change this order, so the pie-chart is displayed first?
I'm on the latest YellowfinBI, release 7.1
Thanks,
Peter
Hello Peter,
Thank you for posting your question on the forum.
I've had a look at your issue / question and have a few
questions for clarification.
- When you saved and used the report, did you edit
the data or just create new charts?
I have walked through the steps you have outlined in
the latest version of 7.1 (Dec) and thus far have been unable
to replicate you issue.
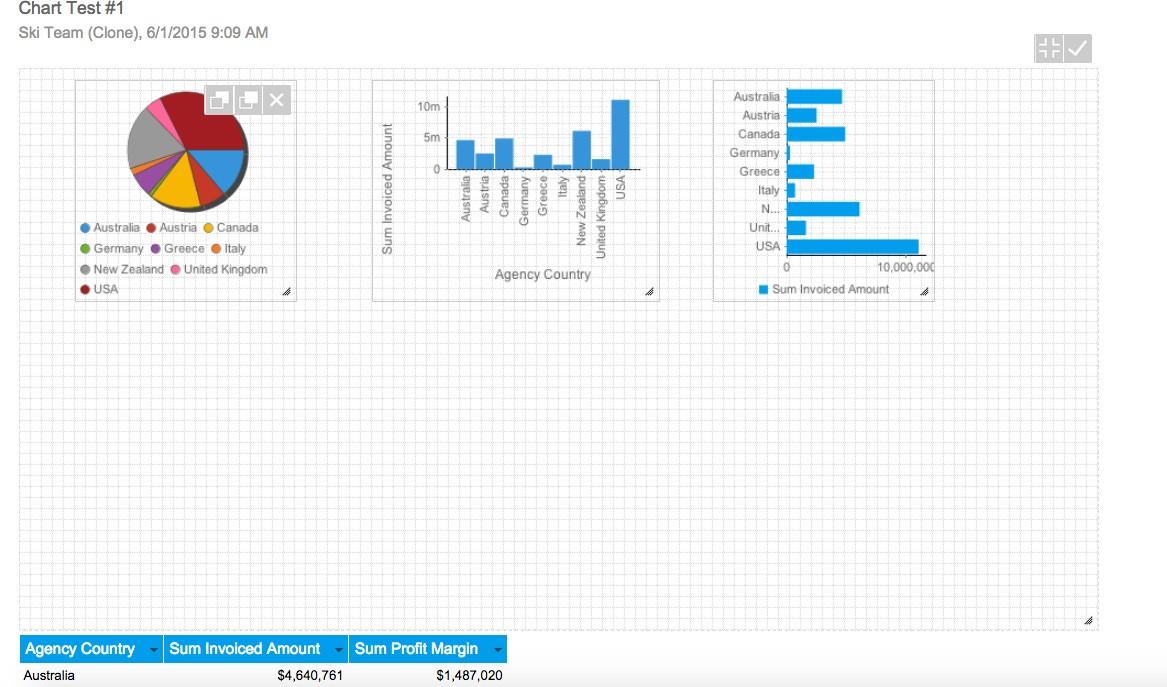
I've made a basic report with 3 charts and then placed
them on the canvas. This is where you should be able to
set the order of your charts.

I saved the report then when back in and edited the report,
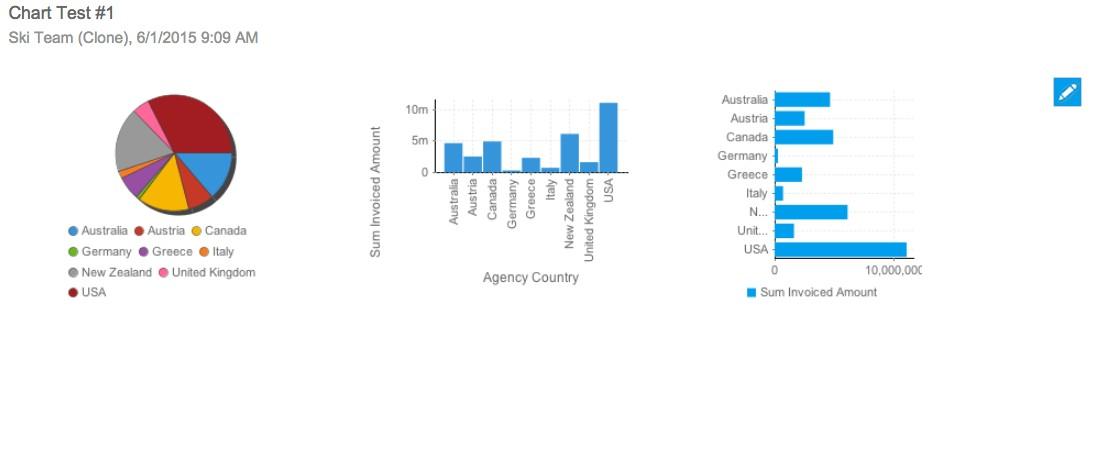
adding a table and two other charts. In the output page you
need to hit the 'pencil' icon on the right in order to add the
two additional charts.
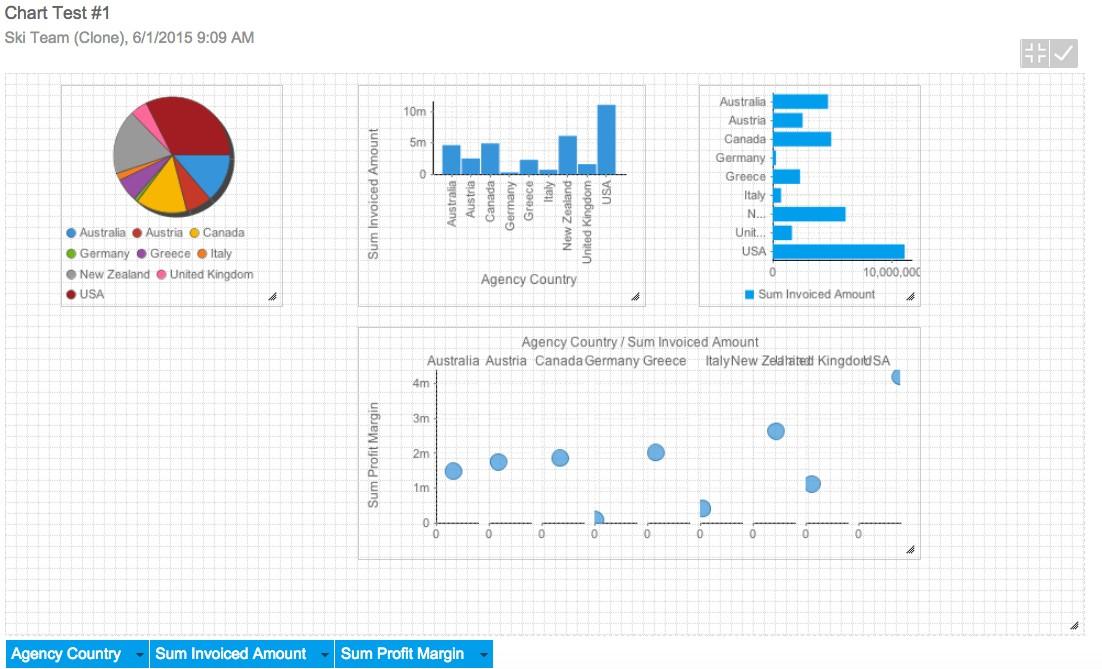
I'm then able to add the additional charts from the left side
box. I'm also able to move the charts again to wherever I
want to display them.
Please let me know if these are the steps you have taken or
if there is something that I'm missing.
Thank you,
Kyle
Thank you for posting your question on the forum.
I've had a look at your issue / question and have a few
questions for clarification.
- When you saved and used the report, did you edit
the data or just create new charts?
I have walked through the steps you have outlined in
the latest version of 7.1 (Dec) and thus far have been unable
to replicate you issue.
I've made a basic report with 3 charts and then placed
them on the canvas. This is where you should be able to
set the order of your charts.
I saved the report then when back in and edited the report,
adding a table and two other charts. In the output page you
need to hit the 'pencil' icon on the right in order to add the
two additional charts.
I'm then able to add the additional charts from the left side
box. I'm also able to move the charts again to wherever I
want to display them.
Please let me know if these are the steps you have taken or
if there is something that I'm missing.
Thank you,
Kyle
Hi Kyle,
I totally forgot to edit the canvas after I created my charts, so problem solved!
Thanks!
Peter
Hello Peter,
Thank you for letting us know that your issue
has been resolved. Great to here.
Cheers,
Kyle
Thank you for letting us know that your issue
has been resolved. Great to here.
Cheers,
Kyle