
my location
11 August, 2014
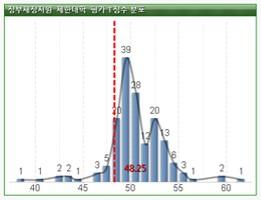
I would like to put a certain value on the chart.
Let's assume that there are 100 samples and this shapes a normal distribution.
As shown in the image that I attached, I would like to put a point and a relative location in the graph.
Thank you.
Hi,
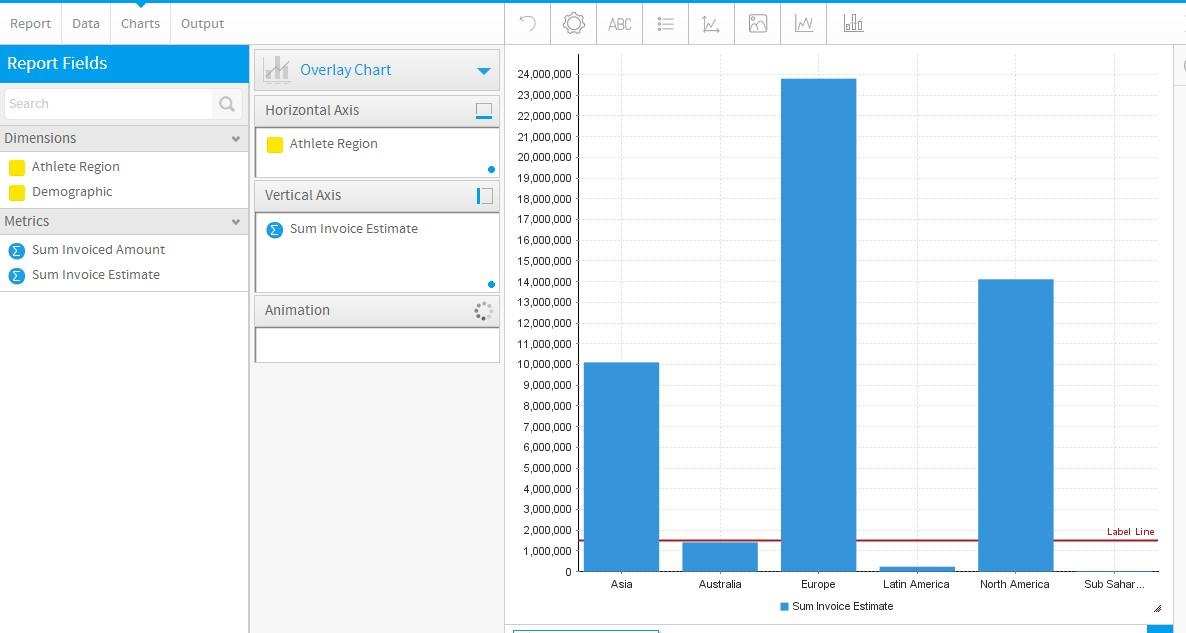
I think what you're after can be achieved using a ref line.
Please see the 'Scale' section of the following wiki page: Chart Formatting
See the example below:

Please let me know if this doesn't give you what you were after.
Regards,
David
I think what you're after can be achieved using a ref line.
Please see the 'Scale' section of the following wiki page: Chart Formatting
See the example below:
Please let me know if this doesn't give you what you were after.
Regards,
David