
Business users drive demand for data visualization, Collaborative BI and Mobile BI
Prepare to be bedazzled. Dresner Advisory Services (DAS) newly released 2012 global Wisdom of Crowds Business Intelligence Market Study – in which Yellowfin ranked equal first (sorry, but we’re gonna keep bashing you over the head with that at every opportunity) – showed that “end user ‘self service’” is the equal top Business Intelligence (BI) technology priority.
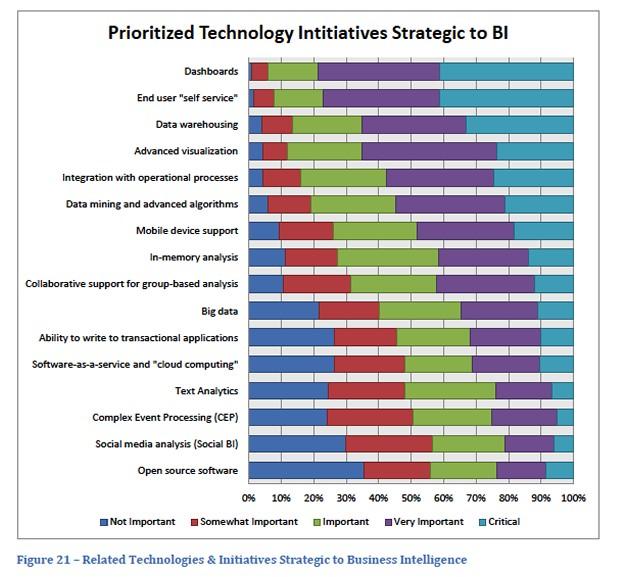
Self-service capabilities tied with “dashboards” as the most sought after BI capability, with 42 percent of survey respondents stating that each competency was “critical”. Less than 10 percent of study participants said that self-service BI was unimportant or even “somewhat important” combined.
And while the consumerization of BI might not be a revelation, the aspects of technology development that this overarching trend is driving, is noteworthy.
An increasingly vocal, and proportionally large, conglomerate of business users is shaping BI product development by demanding intuitive interactivity and user engagement.
This growingly diverse and less technically adept audience is being driven by, and is simultaneously driving, the embracement of consumer-oriented Web 2.0 features and functionality made infamous by the globe’s most prolific social media and information sharing platforms.
So what impact is this having on reporting and analytics?
Marketers and salespeople driving visualization, collaboration and mobility
Well, it seems that business user demands are responsible for the ‘coolification’ of BI – the rapid evolution and migration of business analytics from the corner offices of the most hardcore data junkies, to the latest portable devices of the modish and savvy Ray-Ban wearing marketers.
Dresner’s 2012 Wisdom of Crowds BI Market Study clearly shows that the more creative business users – those working in sales and marketing – are keen to blur the boundaries between enterprise and leisure-time applications. A trend that’s also boosting BI’s sex appeal by more than a few badly needed basis points.
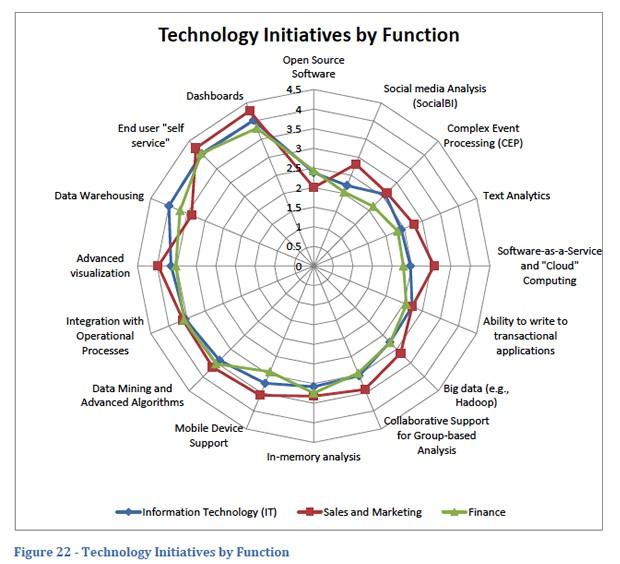
Note on scale: 1 = unimportant, 2 = somewhat important, 3 = important, 4 = very important, 5 = critical
On a scale of one to five – compared to BI users from IT and finance backgrounds – sales and marketing personnel perceive new age capabilities such as advanced data visualization, Mobile BI and Collaborative BI as more important.
A closer look: Advanced data visualization by function
The study provided a detailed analysis of the importance placed on advanced data visualization capabilities by function.
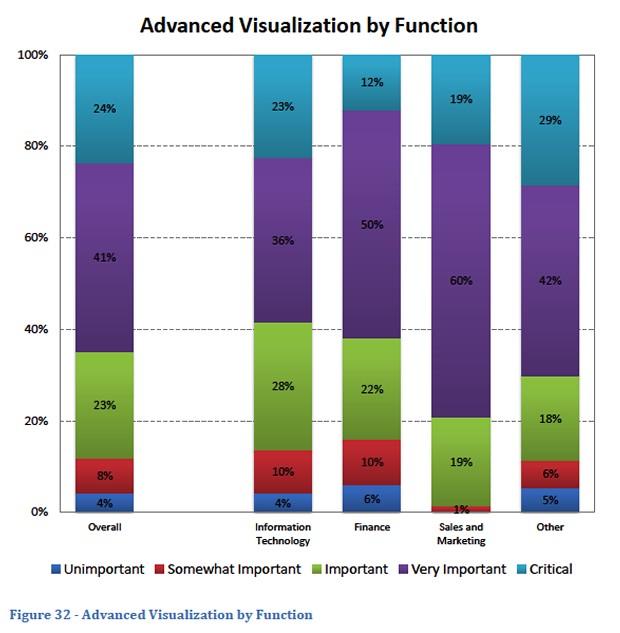
BI users from sales and marketing departments demonstrated an overwhelming desire to view and present data in highly visual formats. Only one percent of survey respondents from a sales or marketing background thought that data visualization was anything less than important.
Conversely, the traditional users and custodians of BI – the IT department – reflected the values of old-school BI products, users and vendors, comparatively placing the least amount of importance on data visualization features and functionality. Only 59 percent of IT pros considered advanced visualization to be “very important” or “critical”.
Where to next?
It seems inevitable that as vendors uncover a much wider audience for BI products, via a far larger potential business user community, the BI industry will continue to move from geek to chic – whether the IT purists like it or not.
Download your own copy of DAS’ 2012 Wisdom of Crowds BI Market Study HERE >