
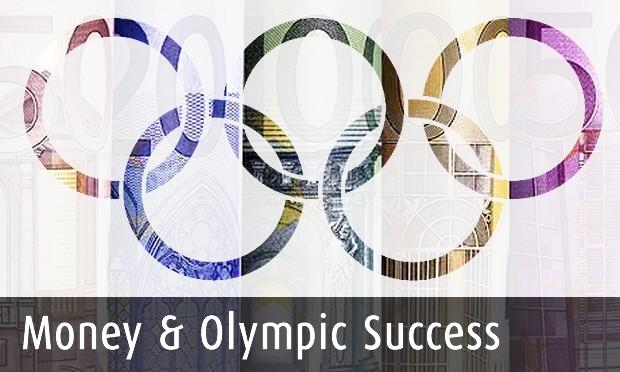
Does money buy medals? Analyzing the affect of GDP on Olympic success
Today’s data visualizations and infographics brought to you by Yellowfin; now making Business Intelligence even easier.
For all its finer qualities and aspirational mandate – aimed at promoting a sense of global tolerance, community and unity – the Olympic Games is big business.
London 2012 is no exception to this reality, as the remorseless claws of commerce, and unrelenting certainties of a capitalists way of life, simultaneously support, demand and shape the modern Summer Games. And its athletes are no more immune to these economic pressures than the event itself – whether its giant duopolies attempting to sell more sneakers or governments endeavoring to raise the national profile.
Only this morning, Shaun Carney – Associate Editor of The Age (debatably Australia’s most revered broadsheet newspaper) – pointed to cuts in Australian government spending as one key reason for the sub-par Aussie performance in London. The article also shamed a report that suggested that “more public money should go to community-based sports ahead of some elite, Olympics-oriented sports”, and that “getting gold medals in the Olympic games was too costly”.
Carney’s culminating point was that the financial support of an Olympic contingent from its government directly affected the ability of that national team to take home medals. He than added that, because Olympic athletes were funded by tax-payer dollars, the public had a right to be upset with their nation’s athletes if they turned in a poor Olympic showing.
These ideas are no doubt applicable to most, if not all, nations currently competing at the Games of the XXX Olympiad. We also know, thanks to our earlier Olympic data blog – Analyzing Olympic success by country with data visualization – that a record number of countries (205) are competing at London 2012 – 12 more than the number of member nations of the United Nations.
So, the continued diversification of the Summer Games – in terms of national representation – is unquestionable. But have the spoils of the Games been shared between an increasing, equally diversifying, and representative number of countries too? And what role does financial capacity play in a nations’ Olympic performance?
Number of medal winning countries over time at the Summer Games (1896 – 2008)
Despite some early fluctuation, that saw the number of medal winning countries drop from 19 at the inaugural Games at Athens in 1896 to just 10 at the 1904 World’s Fair Games in St. Louis, it’s immediately evident that medals are being won by an increasingly varied number of nations.
Other notable dips in the number of countries participating in the Summer Olympics occurred at the Montreal Olympics of 1976, and the 1980 Moscow Games, due to infamous international boycotts. For all the details, go here: Assessing the diversification of medal winners by nationality at the Olympic Games
However, assessing the increasing spread of medal winning countries over time as a percentage offers an easier method for clear trend identification.
Medal winning regions as a percentage over time at the Summer Games (1896 – 2008)
Analyzing the number of Olympic medals won by geographic region by year, as a percentage of total medals won at each Olympic meet, enables for the true impact and extent of medal diversification to be quickly established. For example, whilst more countries are winning Olympic medals, how many medals are they capturing compared to traditionally strong Olympic nations? Is their success fairly minor or more pronounced?
Since the first modern Olympic Games, the landscape of medal-winning nations has changed – markedly. In 1896, European combatants secured 79 percent of all medals. When Olympic competition resumed following World War II in 1948, that complexion had radically transformed, with European mantelpieces adorned by only 47 percent of all medals. Since that dramatic dip, the percentage of total Olympic medals won by European nations has remained fairly consistent – by the Beijing 2008 Games, that percentage had only fallen marginally to 45.
The turn-of-the-century is also marked by the arrival and growth of many medal-winning regions including South America, Latin America, Asia, the Middle East and Africa. Olympic success was, and is, no longer a European-dominated joy.
Total medal value by region as a percentage over time at the Summer Games (1896 – 2008)
Again, assessing the total medal value – where a Gold medal is worth three points, Silver two and Bronze one – as percentage over time throughout the history of the modern Summer Games tells a similar story. Or does it?
Analyzing the spread of medals by medal value produces a prominent spike for the region “North America”, which claimed a staggering 86.861% of the total medal value from the 1904 Summer Olympics. However, a quick Google search promptly puts the figure in perspective. The Games of the III Olympiad were held in St. Louis, Missouri, as part of the famous World’s Fair. Fifty-eight percent of all athletes that competed were from the United States, producing a lopsided outcome in which the USA won 239 of the total 280 medals awarded.
Perhaps more importantly, it’s also apparent that the breadth and depth of regional diversity diminishes when assessing medals awarded as a percentage of total medal value, as opposed to a percentage of medals won by geographic region. So, what does this indicate?
The result seems to demonstrate that, although more countries are increasingly able to elevate their sportspersons to the Olympic dais, the competitors of less economically able nations will continue to struggle to remove the more traditional power-nations from the podium’s highest step. For more in-depth analysis, go to our Assessing the diversification of medal winners by nationality at the Olympic Games blog.
Gross Domestic Product (GDP) vs total country medal value at the Summer Games (1968 – 2008)
Those suspicions are quickly confirmed when comparing a country’s total Olympic medal value to its GDP.
Essentially, a direct – and pervasively accurate – correlation can be derived. With very few exceptions, aside from Australia’s miserable performance in London, the wealthiest nations have experienced greater success at the Summer Games.
So which countries are actually the best-performed nations at the Summer Games, considering the direct impact of GDP?
GDP divided by country medal value at the Summer Games (1968 – 2008, for countries with available GDP data)
When dividing a country’s GDP by its total medal value to ascertain the strength of its Olympic career, Tsonga earns a Gold medal for performance, with the best total medal value to GDP ratio (1:159).
And, despite its well-publicized economic woes, Zimbabwe comes in second with a total medal value to GDP ratio of 1:193.
Zimbabwe has competed at the Olympics under that name since the 1980 Moscow Games. Zimbabwe has sent athletes to every Summer Olympics since 1980. Zimbabwean athletes have won eight medals (three Gold, four Silver and one Bronze), with seven coming in the 2004 Athens Olympics (three) and 2008 Beijing Games (four).
But what about population size? Smaller nations have a much sparser economic pool to draw from when training and sending athletes to the Olympics. So which countries are the best-performed nations at the Summer Games if we divide each nation’s population by its total medal value?
Country population divided by country medal value at the Summer Games (1968 – 2008)
Once again, the people of Tsonga can hold their heads high.
However, if both the size of a country’s GDP and its population were valid yardsticks with which to measure its Olympic performance, wouldn’t the ultimate test be to divide each nation’s medal value by its per capita GDP?
Per capita GDP divided by country medal value at the Summer Games (1968 – 2008, for countries with available GDP data)
And the ultimate Olympic champion is…
Zimbabwe; with a ratio of 1:15.6. Burundi proudly stands on the dais’ second step (1:38), while long-distance running powerhouse Ethiopia snatches third place on the podium (1:77.3).
Despite Zimbabwe’s, Burundi’s, Ethiopia’s and Tsonga’s victories (of sorts), we’ve indisputably established that a country’s economic muscle directly impacts its ability to win more medals and achieve higher total medal values at the Summer Games.
So, it begs the question: Are (Gold) medals won? Or are they bought?
Where to next?
Keep a lookout for our series of Olympic data blogs, appearing daily until London’s Closing Ceremony (12 August).