
Analyzing the spread of medal winners by nationality at the Winter Games
Slicing through the snow and ice at seemingly out-of-control speeds; majestically summersaulting through the air; aggressively jostling for prime position; and gracefully pirouetting with improbable precision.
The Winter Olympics is both captivating and contrasting. And Sochi 2014, the 22nd Winter Olympic Games, has personified this divergent theme, having no trouble generating headlines as a result.

The Sochi Games: Captivating and contrasting
Athletes have simultaneously praised Sochi’s facilities, which purportedly cost in excess of $US 50 billion, while bizarrely criticizing some courses as too cheap (some snowboarders labeled Sochi’s Halfpipe as “garbage”) or too risky (US cool kid Shaun White pulled out of the Slopestyle event, identifying it as “intimidating”).
And, while the Games have only just begun, it seems that this juxtaposing trend was best embodied in the Opening Ceremony. Creative Director of the introductory festivities, Konstantin Ernst, may be looking for a new job after one of the five enormous glittering Olympic rings failed to light-up.

One report in The Telegraph facetiously suggested that Mr Ernst was “being removed from Sochi’s ski slopes and transported to the icy wastes of Siberia” immediately. However, whilst it’s safe to say that Russian President and strongman, Vladimir Putin, was (visibly) displeased by “the ring incident”, the rest of the world was highly amused by the Red Army Choir’s cover of Daft Punk’s Grammy Award-winning hit, Get Lucky.
Diversity of nations represented at the Winter Olympics
But, it’s not just the organizers, athletes and entertainers that have combined to create a diverse spectacle. There are also a record number of countries competing for glory at Sochi – 88 to be precise – represented by over 2,800 combatants showcasing their skills across 98 events (12 new).
By contrast, the first Winter Olympics – held in Chamonix, France in 1924 – saw 16 nations compete across 16 events. Britain fielded the largest team, sending 44 participants out of a total athlete delegation of just 304.
At Sochi 2014, the United States (230), Canada (220) and Russia (225) have, somewhat predictably, contributed the largest contingents. While Australia, Canada, Netherlands, Switzerland and the US have sent their largest squads ever to this year’s Winter Games, 18 countries have sent just one athlete – five of which are making their Winter Olympic debut (Zimbabwe, Malta, Paraguay, Tonga and Timor-Leste).
So, all these numbers got us thinking. Whilst it’s indisputable that many more nations are now represented at the Sochi Games than in 1924, does this mean that Olympic success is also becoming more evenly distributed throughout the globe? Or, does the widening gulf in Olympic funding and athlete count by nation just mean that there’s simply more people ‘making up the numbers’? Maybe the continued rise of the Superpowers in Olympic winter sports has resulted in a further concentration in Winter Games triumph?
To discard the guesswork, and discover in what direction this trend is actually heading, we’ve turned to Business Intelligence and data visualization to showcase the facts.
Number of Olympic medal-winning countries over time
It’s immediately obvious that a larger number of nations have been, progressively, experiencing Olympic excellence at the Winter Games. While only 10 countries took home medals in 1924, 26 did so in Vancouver 2010. However, whilst there’s a discernable trend over time towards greater national diversity amongst medal-winning athletes at the Winter Olympics, there’s something else you should know.
Proportionally, it seems that there’s actually been a concentration in Olympic success. Medals at Vancouver 2010 were spread amongst roughly two-and-a-half times the number of countries compared to the inaugural Games in Chamonix. However, there were over five times the number of countries competing at Vancouver 2010 (82 nations) compared to Chamonix 1924 (16 nations).
It’s also interesting to note the minor variations in an otherwise consistent upwards trend towards medal diversification by nation. The number of medal-winning countries dropped from 12 in 1928 (St. Moritz, Switzerland) to 10 in 1932 (Lake Placid, USA). This figure can ostensibly be explained by the tribulations of the Great Depression, which saw only 17 nations compete in 1932, compared to 25 in 1928.
The 1964 Games – in Innsbruck, Austria – saw medals go to 14 countries compared to 15 at the previous Winter Olympic meet. This outlier could be attributed to several factors, including: The fact that East and West Germany entered a combined team, and the dominance of the conglomerate of eastern European nations that was the USSR (the Soviets won the most medals at Innsbruck 1964).
While the dominance of the Soviet Union was again on display in 1976 – winning the most medals (13 gold, six silver and eight bronze) out of any nation, the 1984 and 1988 Winter Games seem to be something of an anomaly.
A then record 49 countries competed in Sarajevo, Yugoslavia in 1984, with Egypt, Monaco, Puerto Rico, Senegal and the British Virgin Islands participating for the first time. The People’s Republic of China also ceased their boycott and Taiwan (Chinese Taipei) participated for the first time. Similarly, a then record 57 nations sent athletes to Calgary, Canada in 1988.
But while – despite the above exceptions – the number of medal-winning countries has increased over time, has the trend been reflected within medal types? Or, have a handful of countries been going for (and achieving) gold, with only the minor spoils being more widely dispersed?
Number of Olympic medal-winning countries by medal type over time
Before analysis, it would have been logical to assume that gold medals would have been shared among the fewest nations, with silver and bronze proving the second and third most exclusive clubs respectively. However, it appears the number of medal-winning countries, assessed by medal type, has remained fairly even over time.
In absolute terms – adding the number of nations to have won gold, silver and bronze medals from each of the 21 previous Winter Olympic Games together – the relative exclusivity (by country) of gold, silver and bronze medals is perhaps more obvious: Gold (247), silver (267), bronze (284).
The outcome? The original hypothesis is probably confirmed – if only marginally. Given the results of our analysis, it seems fair to suggest that the higher steps of the dais are more frequently reserved for those nations with climates and economies that are traditionally conducive to producing supremacy in winter sports.
But what other factors might be advantageous for nations going for Olympic glory? Does being the host nation place you on the podium more often? Are athletes spurred to greater heights by a wave of nationalistic fervor and support? Or, does the added pressure of being the ‘hometown heroes’ lead to underperformance and heartache?
Percentage of total medal value, by medal type, won by the host nation over time
A definitive trend – regarding the percentage of medals and medal types won by host nations over time – seems difficult to identify.
Note: To design this chart, we assigned a value to each medal type – gold (3), silver (2) and bronze (1). Each bar depicted on the chart represents the percentage of the total medal value won by the host nation of that year’s Winter Games. The total medal value is the total numeric value of all medals up for grabs at each Winter Games.
It seems reasonable to submit that host nations should have an inherently better chance at winning medals because, logistically, they can afford to send a larger contingent of athletes. But, does that improve the quality, and therefore medal-winning potential, of that Olympic team? Perhaps not.
France hosted the first ever Winter Games in 1924, failing to win any gold medals, and finishing with just three bronze. Switzerland, hosts of the second Winter Olympics in 1928, suffered a similarly meek Games, winning only a single bronze medal. Yugoslavia and Canada also experienced comparably lean medal hauls as host nations in 1984 and 1988 respectively.
By contrast, the USA secured 33.3% of the total medal value on offer at the 1932 Winter Games (including 42.8% of the total gold medal value), winning the medal tally outright (six gold, four silver, and two bronze). This overwhelming dominance (Norway finished second with three gold, four silver and three bronze medals; with Sweden placing third with one gold and two silver) is most likely due to the economic circumstances that surrounded the 1932 Winter Games. Held in the midst of the Great Depression, the number of countries participating dropped from 25 at the previous Winter Games of 1928 to just 17 in 1932. Not only did this reduce the number and quality of competing nations, it also allowed America the luxury of fielding a comparatively larger team because, as host nation, it was logistically possible to send more athletes at relatively small incremental costs. Many competing countries reduced the size of their Olympic teams from 1928 to 1932, due to financial pressures associated with the Great Depression.
So perhaps, as previously indicated, the success of nations at the Winter Olympics simply depends on the suitability of their weather and scale of funding for Olympic winter sports. Thoughts?
Where to next?
Stay tuned for our continuing series of Winter Olympic data blogs, appearing throughout Sochi 2014 (7th – 23rd February).
The Winter Olympics is both captivating and contrasting. And Sochi 2014, the 22nd Winter Olympic Games, has personified this divergent theme, having no trouble generating headlines as a result.
The Sochi Games: Captivating and contrasting
Athletes have simultaneously praised Sochi’s facilities, which purportedly cost in excess of $US 50 billion, while bizarrely criticizing some courses as too cheap (some snowboarders labeled Sochi’s Halfpipe as “garbage”) or too risky (US cool kid Shaun White pulled out of the Slopestyle event, identifying it as “intimidating”).
And, while the Games have only just begun, it seems that this juxtaposing trend was best embodied in the Opening Ceremony. Creative Director of the introductory festivities, Konstantin Ernst, may be looking for a new job after one of the five enormous glittering Olympic rings failed to light-up.
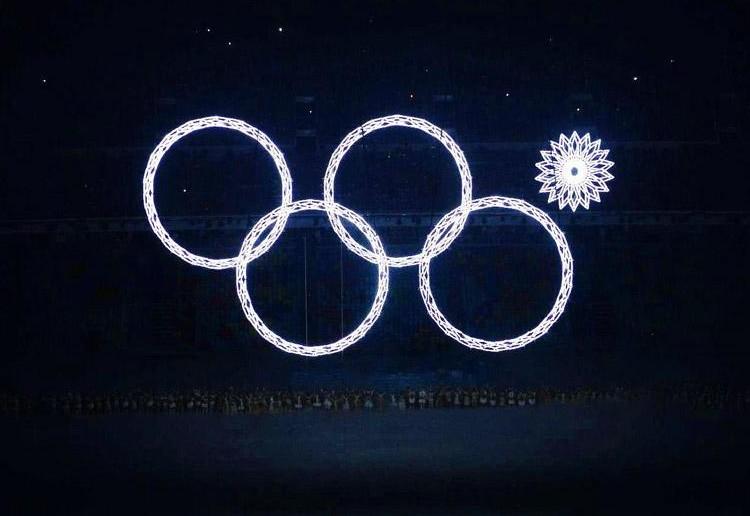
One report in The Telegraph facetiously suggested that Mr Ernst was “being removed from Sochi’s ski slopes and transported to the icy wastes of Siberia” immediately. However, whilst it’s safe to say that Russian President and strongman, Vladimir Putin, was (visibly) displeased by “the ring incident”, the rest of the world was highly amused by the Red Army Choir’s cover of Daft Punk’s Grammy Award-winning hit, Get Lucky.
Diversity of nations represented at the Winter Olympics
But, it’s not just the organizers, athletes and entertainers that have combined to create a diverse spectacle. There are also a record number of countries competing for glory at Sochi – 88 to be precise – represented by over 2,800 combatants showcasing their skills across 98 events (12 new).
By contrast, the first Winter Olympics – held in Chamonix, France in 1924 – saw 16 nations compete across 16 events. Britain fielded the largest team, sending 44 participants out of a total athlete delegation of just 304.
At Sochi 2014, the United States (230), Canada (220) and Russia (225) have, somewhat predictably, contributed the largest contingents. While Australia, Canada, Netherlands, Switzerland and the US have sent their largest squads ever to this year’s Winter Games, 18 countries have sent just one athlete – five of which are making their Winter Olympic debut (Zimbabwe, Malta, Paraguay, Tonga and Timor-Leste).
So, all these numbers got us thinking. Whilst it’s indisputable that many more nations are now represented at the Sochi Games than in 1924, does this mean that Olympic success is also becoming more evenly distributed throughout the globe? Or, does the widening gulf in Olympic funding and athlete count by nation just mean that there’s simply more people ‘making up the numbers’? Maybe the continued rise of the Superpowers in Olympic winter sports has resulted in a further concentration in Winter Games triumph?
To discard the guesswork, and discover in what direction this trend is actually heading, we’ve turned to Business Intelligence and data visualization to showcase the facts.
Number of Olympic medal-winning countries over time
It’s immediately obvious that a larger number of nations have been, progressively, experiencing Olympic excellence at the Winter Games. While only 10 countries took home medals in 1924, 26 did so in Vancouver 2010. However, whilst there’s a discernable trend over time towards greater national diversity amongst medal-winning athletes at the Winter Olympics, there’s something else you should know.
Proportionally, it seems that there’s actually been a concentration in Olympic success. Medals at Vancouver 2010 were spread amongst roughly two-and-a-half times the number of countries compared to the inaugural Games in Chamonix. However, there were over five times the number of countries competing at Vancouver 2010 (82 nations) compared to Chamonix 1924 (16 nations).
It’s also interesting to note the minor variations in an otherwise consistent upwards trend towards medal diversification by nation. The number of medal-winning countries dropped from 12 in 1928 (St. Moritz, Switzerland) to 10 in 1932 (Lake Placid, USA). This figure can ostensibly be explained by the tribulations of the Great Depression, which saw only 17 nations compete in 1932, compared to 25 in 1928.
The 1964 Games – in Innsbruck, Austria – saw medals go to 14 countries compared to 15 at the previous Winter Olympic meet. This outlier could be attributed to several factors, including: The fact that East and West Germany entered a combined team, and the dominance of the conglomerate of eastern European nations that was the USSR (the Soviets won the most medals at Innsbruck 1964).
While the dominance of the Soviet Union was again on display in 1976 – winning the most medals (13 gold, six silver and eight bronze) out of any nation, the 1984 and 1988 Winter Games seem to be something of an anomaly.
A then record 49 countries competed in Sarajevo, Yugoslavia in 1984, with Egypt, Monaco, Puerto Rico, Senegal and the British Virgin Islands participating for the first time. The People’s Republic of China also ceased their boycott and Taiwan (Chinese Taipei) participated for the first time. Similarly, a then record 57 nations sent athletes to Calgary, Canada in 1988.
But while – despite the above exceptions – the number of medal-winning countries has increased over time, has the trend been reflected within medal types? Or, have a handful of countries been going for (and achieving) gold, with only the minor spoils being more widely dispersed?
Number of Olympic medal-winning countries by medal type over time
Before analysis, it would have been logical to assume that gold medals would have been shared among the fewest nations, with silver and bronze proving the second and third most exclusive clubs respectively. However, it appears the number of medal-winning countries, assessed by medal type, has remained fairly even over time.
In absolute terms – adding the number of nations to have won gold, silver and bronze medals from each of the 21 previous Winter Olympic Games together – the relative exclusivity (by country) of gold, silver and bronze medals is perhaps more obvious: Gold (247), silver (267), bronze (284).
The outcome? The original hypothesis is probably confirmed – if only marginally. Given the results of our analysis, it seems fair to suggest that the higher steps of the dais are more frequently reserved for those nations with climates and economies that are traditionally conducive to producing supremacy in winter sports.
But what other factors might be advantageous for nations going for Olympic glory? Does being the host nation place you on the podium more often? Are athletes spurred to greater heights by a wave of nationalistic fervor and support? Or, does the added pressure of being the ‘hometown heroes’ lead to underperformance and heartache?
Percentage of total medal value, by medal type, won by the host nation over time
A definitive trend – regarding the percentage of medals and medal types won by host nations over time – seems difficult to identify.
Note: To design this chart, we assigned a value to each medal type – gold (3), silver (2) and bronze (1). Each bar depicted on the chart represents the percentage of the total medal value won by the host nation of that year’s Winter Games. The total medal value is the total numeric value of all medals up for grabs at each Winter Games.
It seems reasonable to submit that host nations should have an inherently better chance at winning medals because, logistically, they can afford to send a larger contingent of athletes. But, does that improve the quality, and therefore medal-winning potential, of that Olympic team? Perhaps not.
France hosted the first ever Winter Games in 1924, failing to win any gold medals, and finishing with just three bronze. Switzerland, hosts of the second Winter Olympics in 1928, suffered a similarly meek Games, winning only a single bronze medal. Yugoslavia and Canada also experienced comparably lean medal hauls as host nations in 1984 and 1988 respectively.
By contrast, the USA secured 33.3% of the total medal value on offer at the 1932 Winter Games (including 42.8% of the total gold medal value), winning the medal tally outright (six gold, four silver, and two bronze). This overwhelming dominance (Norway finished second with three gold, four silver and three bronze medals; with Sweden placing third with one gold and two silver) is most likely due to the economic circumstances that surrounded the 1932 Winter Games. Held in the midst of the Great Depression, the number of countries participating dropped from 25 at the previous Winter Games of 1928 to just 17 in 1932. Not only did this reduce the number and quality of competing nations, it also allowed America the luxury of fielding a comparatively larger team because, as host nation, it was logistically possible to send more athletes at relatively small incremental costs. Many competing countries reduced the size of their Olympic teams from 1928 to 1932, due to financial pressures associated with the Great Depression.
So perhaps, as previously indicated, the success of nations at the Winter Olympics simply depends on the suitability of their weather and scale of funding for Olympic winter sports. Thoughts?
Where to next?
Stay tuned for our continuing series of Winter Olympic data blogs, appearing throughout Sochi 2014 (7th – 23rd February).