
Using Location Intelligence to avoid food poisoning

Data source: HealthData.gov, State of New York, “Food Service Establishment: Last Inspection”.
Data visualization: Data visualization, Business Intelligence solution and commentary brought to you by Yellowfin 7.1: Delivering beautiful maps for brilliant insight.
We’ve all been there. You’ve gone out for that fateful meal and found yourself driving the porcelain bus until the wee hours of the morning.
The mere memory of such encounters – akin to the grotesque gastronomic journey of Mr Creosote in Monty Python’s The Meaning of Life – is enough to leave you feeling nauseated.
So, if possible, wouldn’t you want to avoid those sickening food-induced slogs?
Whilst we can’t make any promises we can definitely, using Location Intelligence (LI), improve your odds.
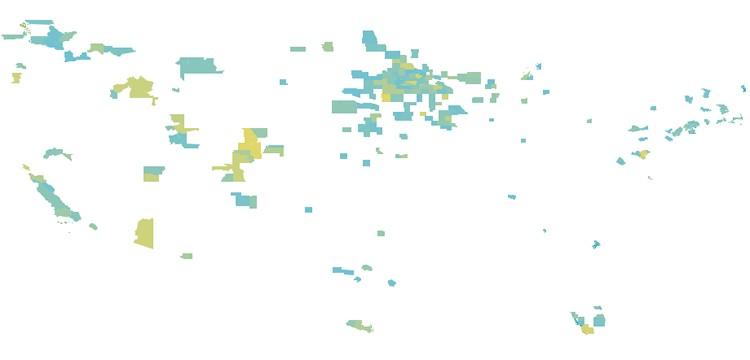
Using Location Intelligence to pinpoint food service violations in the state of New York
Using data obtained from HealthData.gov – contributed via the State of New York and labeled the “Food Service Establishment: Last Inspection” dataset – we’re able to plot the number of “critical” and “non-critical” violations recorded per zip or post code. The dataset is refreshed on a monthly basis.
Note: This dataset excludes inspections conducted in New York City, Suffolk County and Erie County.
Now, to be fair to our restaurateurs, we’ve focused our attention on mapping “critical” rather than “non-critical” violations. Besides, there’s probably a higher likelihood of a correlation between your churning stomach and rats running rife in the fridge, compared to one kitchenhand forgetting to tie-back their hair.


What’s also interesting to note is that while Ballston Spa (zip code 12020) incurred less than a third of the number of critical violations of Saratoga Springs (zip code 12866), it still received 1214 non-critical violation notices – around 50 percent of the number dispatched in Saratoga Springs (2342 non-critical violation). Therefore, for every critical violation recorded in Saratoga Springs, an additional 5.2 non-critical violations were issued. Intriguingly, in Ballston Spa, 8.6 non-critical violations were recorded for every critical violation issued.
So, while the food proprietors of Saratoga Springs are overseeing more dangerous food practices, they have committed fewer non-critical violations as a proportion of critical violations detected.
A correlation between population figures and violation numbers?
Remarkably – even bearing in mind that food service inspection violations for New York City have been excluded from this dataset – there is no definitive correlation between population figures and the number of reported food service violations.
You might expect that highly populated suburbs would record a greater number of violations, as it seems likely that larger population size would mean more eateries and, therefore, a statistically probable chance of more malpractice. However, the aforementioned suburbs of Saratoga Springs (36,752 residents) and Ballston Spa (30,796 residents) have comparable populations, yet markedly different violation counts.
Additionally, Lake George in Warren County (zip code 12845) has a population of just 5,033, but recorded the second highest number of critical violations (384) behind Saratoga Springs. Conversely, Ithaca in Tompkins County (zip code 14850) has a population of 64,394, registering just 36 critical violations.
Geocoding to zip code level: The devil (or poor food service standards) is in the detail
As mentioned in our last blog post, Location Analytics for Business Intelligence: Dude, where’s my context?, to conduct this type of insightful multilayered analysis, it’s integral that you have a detailed base layer on which you’re able to overlay your data. Without the map layer underpinning your data, the visualization lacks the necessary framework to give the information meaning and context (see below).
Likewise though, it’s equally critical that the location-relevant information can be broken down into recognizable, and commonly used, geographic boundaries. For example, how could a government regulator hope to identify useful trends and patterns in New York State food service quality, and then act on that insight, if unable to perform map-based analysis of this Food Service Establishment dataset by zip code or even county?
But, more importantly, imagine the actionable knowledge you’d be able to attain, and interrelationships you’d be able to reveal, about your own business operations using this granularity of map-based analysis.
With the upcoming release of Yellowfin 7.1, the latest version of our Business Intelligence platform, you’ll be able to geocode address data to post code or zip code level, rendering that information on a map with ease, to quickly produce stunning visualizations and actionable insight.
Yellowfin 7.1 will automatically assign post or zip codes, latitude and longitude coordinates as well as polygons to address-level data. These enhanced location analytics capabilities will enable you to immediately geocode selected address or other data to individual zip codes on a map without having to source separate GIS records and geometry points.
Where to next?
Well, after detecting the dangerous dining destinations in New York State – where the hairnets and rodents roam free – maybe you’d like to learn a little more about the insights achievable via integrated location analytics?
To learn more, register for the official launch of Yellowfin 7.1 HERE >
Discover how we’re empowering business users of all backgrounds, and organizations of all sizes, with the Location Intelligence capabilities they need to quickly create beautiful maps that deliver a brilliant analytical experience.