
Business Intelligence vendor Yellowfin furthers self-service BI and Data Discovery capabilities with new data visualization functionality
Global Business Intelligence (BI) and analytics software vendor, Yellowfin, has furthered its ability to support self-service BI and independent Data Discovery with a series of important data visualization enhancements.
The enrichment of Yellowfin’s data visualization capabilities was included within the latest version of its BI platform, Yellowfin 7.1.
Yellowfin 7.1 was released in a series of launch Webinars. The recording can be accessed HERE >
“We want to ensure the best analytical experience possible when using Yellowfin,” said Yellowfin CEO, Glen Rabie. “That’s why we’ve incorporated a raft of visualization improvements in Yellowfin 7.1, to support rapid, free flow visual analysis.”
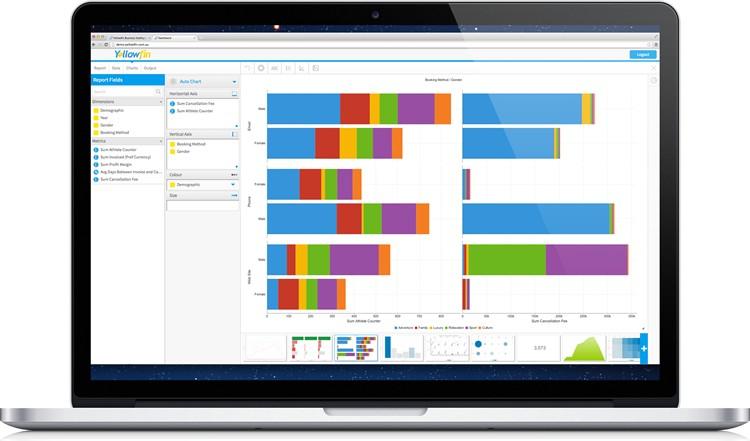
Auto Chart supports over 50 best practice chart types
Yellowfin 7.1 extends the Auto Chart functionality launched in Yellowfin 7, with 16 new chart types now supported by Yellowfin’s Auto Chart feature – including combination charts as well as maps. As a result, Auto Chart now supports over 50 best practice chart types and combinations.
“The end result is that, providing you have selected a metric, any combination of attributes dragged into Yellowfin’s Chart Builder will now instantly create an Auto Chart,” said Rabie. “With Yellowfin 7.1, you don’t have to be a data analyst or a BI expert to generate great visualizations and perform meaningful analysis.”
Increasing the breadth of visualizations supported by Yellowfin’s Auto Chart feature offers further assistance to non-technical business-users, enabling self-service content creation and independent Data Discovery.
Improved color options for Auto Charts
The use of color options within Auto Charts has also been improved dramatically in Yellowfin 7.1. Users can easily apply conditional formatting on an Auto Chart, within the Chart Builder, to create color-coding across dimensions or metrics.
“For example, dragging a metric into the color selection panel of an Auto Chart will automatically define the color of a thematic of bubble map,” said Rabie. “Users also benefit from improved range settings for metric defined colors – across all chart types and all existing Auto Chart combinations.”
Toggle from Auto Chart to manual chart selection
In Yellowfin 7.1, users have the ability to toggle between Yellowfin’s Auto Chart option and manual chart selection, without affecting settings and fields, adding a greater level of flexibility when building visualizations.
“Business users can still enjoy the guided support offered by Auto Charts, while more adept users – with a predefined idea of the style of chart they want to create – can simply toggle to manually create specific visualizations,” said Rabie.
For basic charts in ‘auto’ mode, users can now also seamlessly swap back and forth between chart types without having to rebuild content.
Customizable Big Number charts
Yellowfin’s output canvas, introduced as part of Yellowfin 7’s overhauled Report Builder, enabled users to drag-and-drop multiple charts onto a single space and arrange them side-by-side to produce multi-chart reports – a miniature dashboard type experience for data consumers.
This new feature allowed users to resize the charts, the canvas itself – and add a range of custom widgets (text, images, icons, etc) to the output canvas – to create a customized view of visualizations and add context to multi-chart reports.
“Yellowfin 7.1 adds to this experience by allowing users to also create bespoke Big Number charts within the output canvas,” said Rabie. “This change empowers users to build customized summary charts within a multi-chart report, using the range of available font types within Yellowfin.
“The ability to further customize visualizations via Yellowfin’s output canvas offers improved flexibility, empowering users to quickly add associated content to support a rich and deeply insightful user experience.”
To view a complete list of all the enhancements and additions included in Yellowfin 7.1, GO HERE >
About Yellowfin
Yellowfin is a global Business Intelligence (BI) and analytics software vendor passionate about making BI easy. Founded in 2003 in response to the complexity and costs associated with implementing and using traditional BI tools, Yellowfin is a highly intuitive 100 percent Web-based reporting and analytics solution. Yellowfin is a leader in mobile, collaborative and embeddable BI as well as Location Intelligence and data visualization. For more information, visit www.yellowfinbi.com
For further media information, interviews, images or product demonstration, please contact:
Lachlan James, Communications Manager on +61 (0)3 8617 4954, +61 (0)431 835 658 or lachlan.james@yellowfin.bi
For regular updates and news, follow Yellowfin on Twitter (@YellowfinBI), LinkedIn (Yellowfin Business Intelligence) or email pr@yellowfin.bi to subscribe to Yellowfin’s free e-newsletter.