
Analyzing the 2015 Super Bowl with data visualization
Are you ready? Have you been practicing your game face?
Love it or loathe it, National Football League (NFL) fans across America, and indeed the globe, will be donning their team guernsey, applying their tribal war paint, and making their allegiances clear – all in preparation for the 2015 Super Bowl this weekend.
And, NFL fanatic or not, it’s hard not to get swept up in the grandeur and ritualistic nature of the Super Bowl – an event that, at times, seems more spectacle than sport.
So with the New England Patriots and Seattle Seahawks set to do battle in Super Bowl XLIX – this Sunday February 1st at the University of Phoenix Stadium in Glendale, Arizona – we‘ve used Business Intelligence and data visualization to analyze the enormous economics of that spectacle.
Super Bowl advertising prices skyrocketing
Official broadcaster of Super Bowl 49, NBC, has now sold out all its advertising space. And, with ad space for Sunday’s clash setting a new average cost of $4.5 million (USD) per 30-second slot, that’s some serious coin. By contrast, a 30-second spot during the Academy Awards is less than half the price.
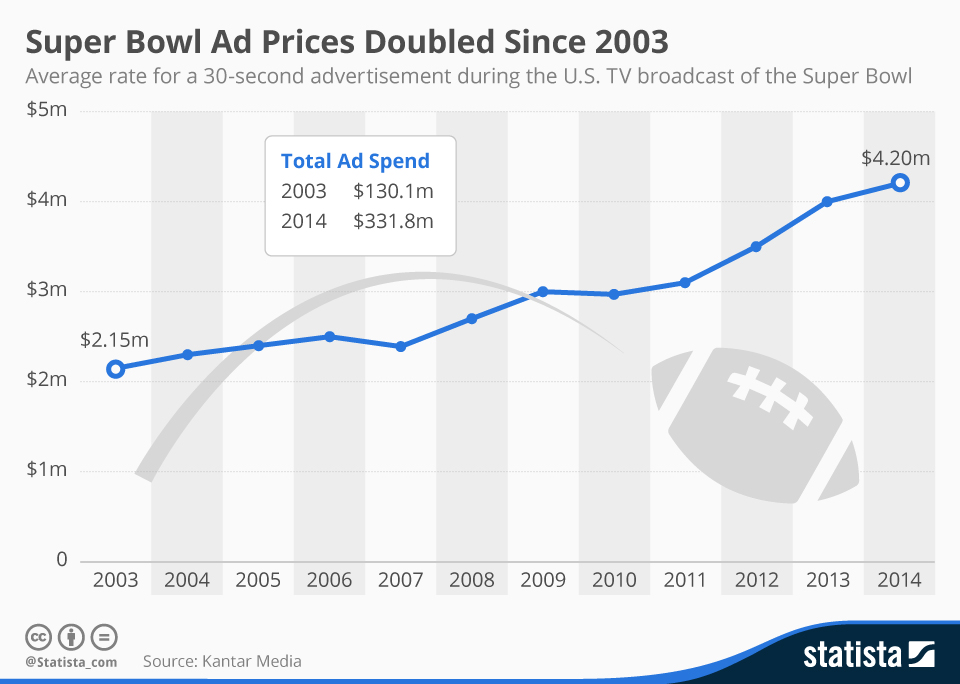
To give you some context, this year’s figure is up from an average of $4.2 million when Fox broadcast the game in 2014, and $3.5 million in 2012 – the last time NBC won the rights to the Super Bowl.
In fact, the average price of a 30-second ad during America’s premier sporting event has more than doubled since 2003 ($2.15m). Similarly, the total ad spend has risen proportionally by comparison, from $130.1 million in 2003, to $331.8 million in 2014.
So, who’s forking out big bucks for your precious eyeballs at Super Bowl XLIX? Well, there’s a wide range of advertisers in 2015, from traditional big spenders to a cluster of newcomers – 15 first-time sponsors in fact.
For the mainstays, it’s hard to go past Budweiser:
As for the new kids on the block, we like the look of this Skittles teaser:
So now we know the who, but, why do these companies pay so much for the privilege of vying for the unofficial title of ‘Best Super Bowl Commercial’? Simple: The massive audience. The Super Bowl, in conjunction with the UEFA Champions League final, boasts the largest TV audience of any annual sporting event in the world.
Assessing Super Bowl TV viewership over time
In recent history, Super Bowl TV advertisers have had access to an audience in excess of 100 million. No fewer than 105 million viewers have tuned in over the last five years, with 2014 setting a new record (111.5 million). And, 2015 is tipped to set a fresh benchmark, with NBC offering 11 hours of free online streaming, according to money.cnn.com.
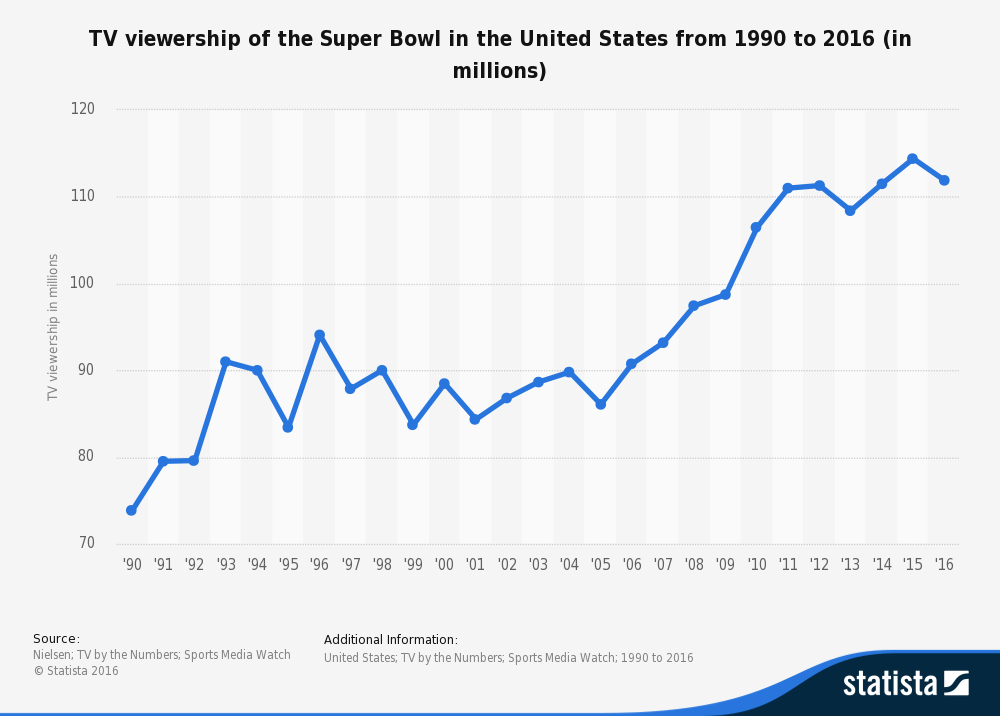
Despite some oscillation through the mid 90s, Super Bowl TV viewership has trended upwards over the last few decades, growing from 73.85 million viewers in 1990 to the current record of 111.5 million in 2014.
What’s interesting is that while total viewership has increased over time, TV ratings for the Super Bowl have fluctuated over time.
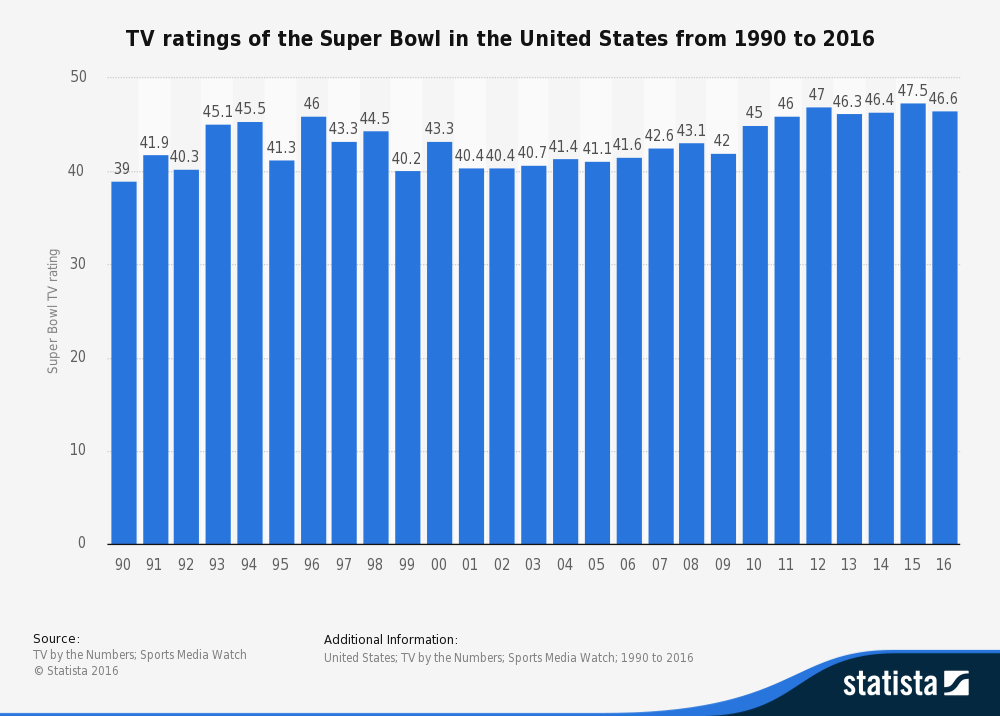
So why is that?
Whilst it’s difficult to offer a definitive answer, some ratings patterns seem to emerge when analyzing TV ratings alongside Super Bowl Champions, divided by NFL Conference.
From 1969 to 1981, a period that was categorized by successive Super Bowl wins by teams from the AFC, TV ratings steadily climbed – from 36 (1969) to 44 (1981). Then, from 1982 to 1992, when teams from the NFC dominated the championship, TV ratings progressively dropped – from 49 (1982) to 40 (1992). A similar pattern can be seen in the new millennium.
So what’s behind this apparent trend? Could it be that AFC fans are a bunch of bandwagoners, who jump on periods of sustained Conference dominance on Super Bowl Sunday, but become disengaged when teams from the NFC enjoy phases of supremacy?
Whatever the case, it’s these sorts of patterns that advertisers care about too, because it’s not just the size of the audience that’s valuable. It’s also their level of engagement. For example, during the 2013 Super Bowl, a mere 0.7 percent of the total audience switched off during commercial breaks (the average ‘tuneaway’ rate during regular programming is five times higher). It seems that almost just as many people watch the Super Bowl for the associated advertising and entertainment as they do for the game itself.
So it’s pretty clear that advertisers have plenty of skin-in-the-game. But it’s not just big corporates that go ‘all in’ during the Super Bowl. The spectators do too.
Consumer spending on the Super Bowl over time
Essentially, with the exception of the short-term aftermath of the Global Financial Crisis, Super Bowl related consumer spending has increased year-to-year from 2007 ($8.7bn) to 2014 ($12.37bn).
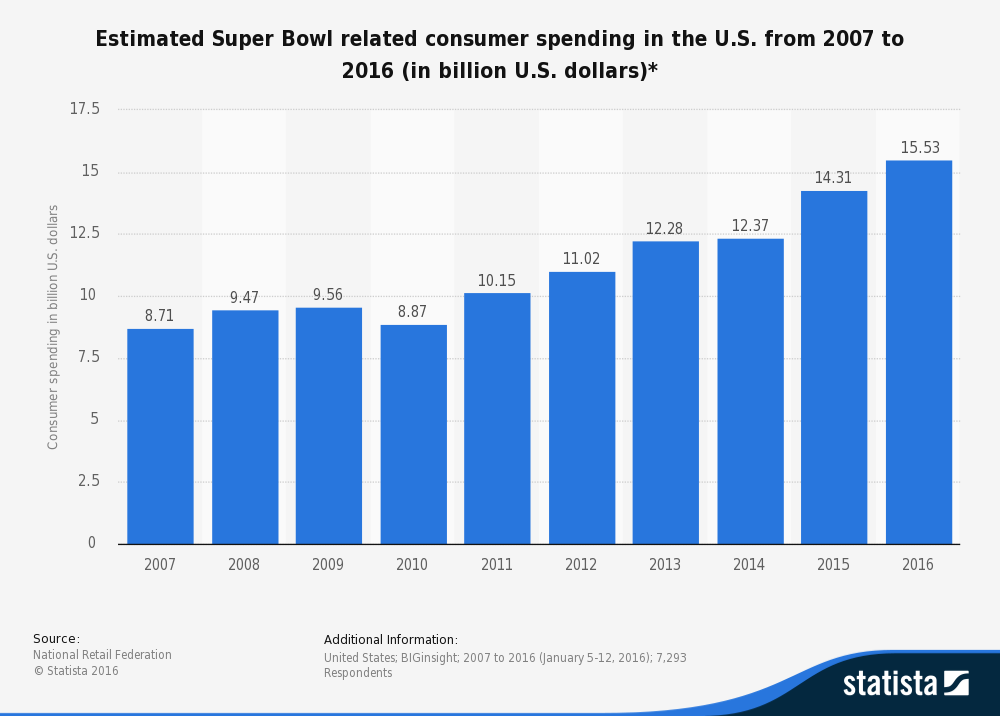
A new record is expected to be set in 2015, with consumers forecast to spend a staggering $14.31 billion on Super Bowl XLIX related products and services across the coming weekend, according to the National Retail Federation.
Betting on the big day is also a favorite activity amongst consumers. Last year, over $100 million was wagered on the Super Bowl in Nevada alone. And, if you too are looking to back a winner on Sunday, we suggest you put your hard earned on the favorite – they win 67% of the time.
But, if you’re looking to have a punt on the 2015 Super Bowl MVP (Most Valuable Player), I’d wait for tomorrow’s follow-up Super Bowl blog by Eshan Wickrema, comparing 2015 Super Bowl quarterbacks Russell Wilson and Tom Brady.