
Data visualization assesses the quirks of Valentine’s Day
Some people love the excuse to unleash their inner romantic. Others resent the commercial overtones. But wherever you stand on Valentine’s Day, you can’t argue with the fact that this much-hyped tradition produces some interesting insights into human behavior.
Using data visualization, via Business Intelligence software, we can analyze those trends.
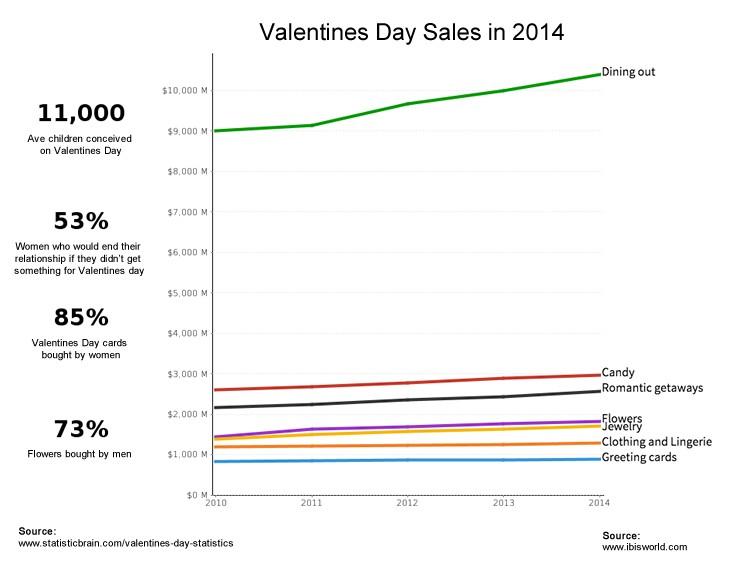
According to US data sourced from www.statisticbrain.com and www.ibisworld.com, spending on Valentine’s Day related purchases has increased across the board from 2010 to 2014, with outlay on romantic dinner dates growing markedly.
While men account for 73 percent of the traditional flower purchases, it’s women who buy the bulk of Valentine’s Day greeting cards (85%). But, the statistics say that Valentine’s Day isn’t just about the light-hearted giving of bargain bouquets and platitudes. Over 11,000 children are conceived on the day, while 53 percent of women admit they would break-up if their man forgot to folk-out on a gift.
So what about 2015? According to the National Retail Federation’s (NRF) Valentine’s Day Consumer Spending Survey, Cupid’s arrow is set to hit hard at the hip pocket, with the average US consumer poised to spend $142.31 celebrating Valentine’s Day 2015. That’s up from an average of $133.91 in 2014.
But, is everyone getting set for a big Valentine’s Day this year?
Valentine's Day 2015: Percentage of people celebrating by age group
The same NRF data shows that while around 60 percent of younger adults (18 – 24, 25 – 34 and 35 – 44 age groups) plan to celebrate Valentine’s Day by purchasing some type of gifts, older consumers aren’t so keen.
The percentage of people planning to celebrate Valentine’s Day 2015 drops off markedly in the older age brackets, with 45 – 54 year-olds (55.4%), 55 – 64 year-olds (50.2%) and those aged 65 and over (43.7%) demonstrating diminished interest.
Valentine’s Day 2015: Gift popularity by age group per category
Predictably, this intent is reflected in 2015 purchase plans, with gifts across all major categories less popular with buyers in the 65-plus category.
While the older (and probably wiser) crowd seem set to purchase fewer Valentine’s Day gifts, it’s interesting to note that they are the most likely to buy unique presents (14% of respondents in this age group selected the “other” gift category when asked about the type of present they intended to purchase). Additionally, greeting cards seem a more popular choice among the oldies, perhaps pointing to generational attitudes when it comes to gift giving.
Younger people (18 – 24 year-olds) buy more candy (68.2% intend to purchase) – probably because they’re not old enough to understand the dental repercussions. Jewelry, clothing and flowers were also more popular gift options amongst the youngest demographic, with 47.2% of 18 – 24 year-olds intending to buy a bouquet.
Valentine’s Day 2015: Average gift spend by age group per category
Unsurprisingly – because those in the 65-plus age group plan to purchase fewer items compared to any other age bracket – the old-timers are forecast to spend the least of any age group across all major gift categories.
Those aged 25 to 34 will spend the most on candy ($32 average), greeting cards ($23 average), clothing ($112 average) and gift cards ($120 average). The 35 – 44 age bracket, perhaps those with a unique combination of strong incomes and remaining desire to externalize romantic notions, will spend the most of any age group on Jewelry ($204 average), as well as flowers ($49 average) and an evening out ($89 average).
While this might all be very revealing in terms of purchase patterns, who exactly are we spending our money on this Valentine’s Day?
Valentine’s Day 2015: Average spend by age group per recipient type
It seems that love, of the romantic variety, demarcates the distribution of dollars, with all age groups spending more on their ‘significant other’ compared to family members, friends and pets.
In fact, when comparing all recipient types, there’s a clear hierarchy that permeates across all age brackets: People spend the most on their partners, then family, then friends, with the household pet receiving the least (monetary) love on Valentine’s Day. However, there is one notable exception: 25 – 34 year-olds spend more on their pets ($44 average) than their friends ($34 average). Ouch.
With the exemption of the 18 – 24 age bracket, who often cling to crumby part-time employment (often whilst studying), people tend to spend less as they get older. Aside from spending on friends, gift buyers in the US aged 25 – 34 years old spend big, compared to other age groups, across all other recipient types. Again, could this be a result of relative youth combined with reasonable levels of disposable income?
Valentine’s Day gift popularity by category over time (2010 – 2015)
When assessing the percentage of people who purchased a Valentine’s Day present in each gift category over time, we can see shifts in popularity.
Candy has increased in popularity over time, with 53.2% of all Valentine’s gift buyers in the US purchasing, or planning to purchase, candy in 2015. This also means that candy will overtake greeting cards as the most popular overall type of gift for the first time this year.
Valentine’s Day average gift spend by category over time (2010 – 2015)
The average jewelry spend per Valentine’s Day buyer has progressively increased over time, from 2010 to 2015, and remains the most expensive gift category by some distance.
The average spend on flowers has also increased steadily (albeit gradually) over time. And, with the exception of 2014, so has an “evening out” ($67 average in 2010, compared to $78 average in 2015).
The average amount spent on gift card purchases has fluctuated over time, and has stagnated for greeting cards.
Interestingly, the NRF survey predicts the highest average consumer spend for five out of seven gift categories for Valentine’s Day 2015 – jewelry ($172), candy ($24), Flowers ($42), evening out ($78) and clothing ($90).
Better check that bank balance now, eh?
Where to next?
Let us know your data-related Valentine’s Day thoughts on Twitter: @YellowfinBI
Have some Valentine’s Day data you’d like to visualize? Or maybe something more business oriented? Whatever the case, grab your free trial copy of Yellowfin by clicking on “Try It Free” HERE >