

A New Yellowfin 9.1 Release
With Yellowfin 9, we introduced to the world an incredibly flexible, action-based dashboard builder and progressive data storytelling capabilities that advance the capability of the dashboard experience.
We’ve received great feedback since then and this month, the newly-released 9.1 further enhances the user experience of analysts, developers, and business users in Yellowfin’s action-based dashboards, data storytelling, and data discovery products.
Read the release notes and change log here.
As it is with every release, enhancements are plentiful but here are a few key highlights:
Dashboards
To bring automated discovery capability to our new action-based dashboards, we’ve introduced a new dashboard code widget for Yellowfin Signals.
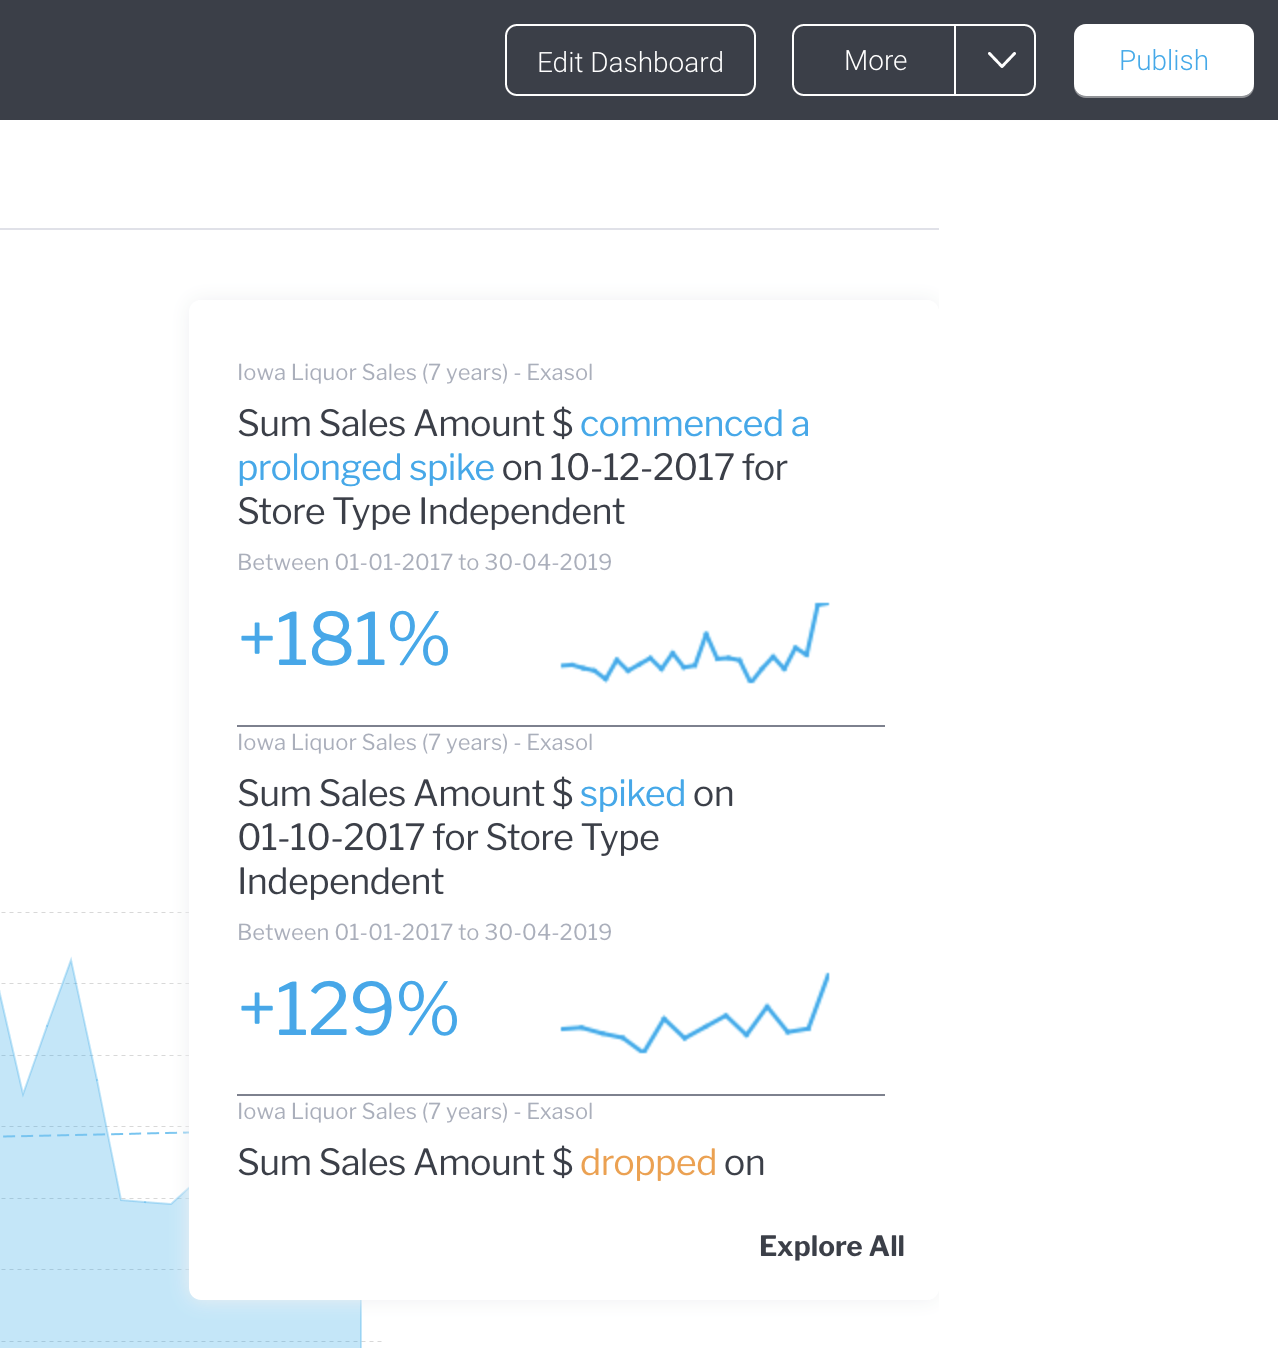
Signals employ advanced capability that automatically identifies critical changes in your data, and surfaces those changes to users so they do not miss a thing. Via a customizable Signals widget, you can now add Signals to your dashboards. The widget can also be filtered to only show signals relevant to the data on the dashboard so that the signals complement the reports on the page.
For Blueprint, we have added support for more charts including scatterplots, maps, heat grids and overlay charts. Quick Charts have also been enhanced to include more auto-configurations for each specific chart, speeding up the process of creating simple and advanced visualizations directly on the dashboard.
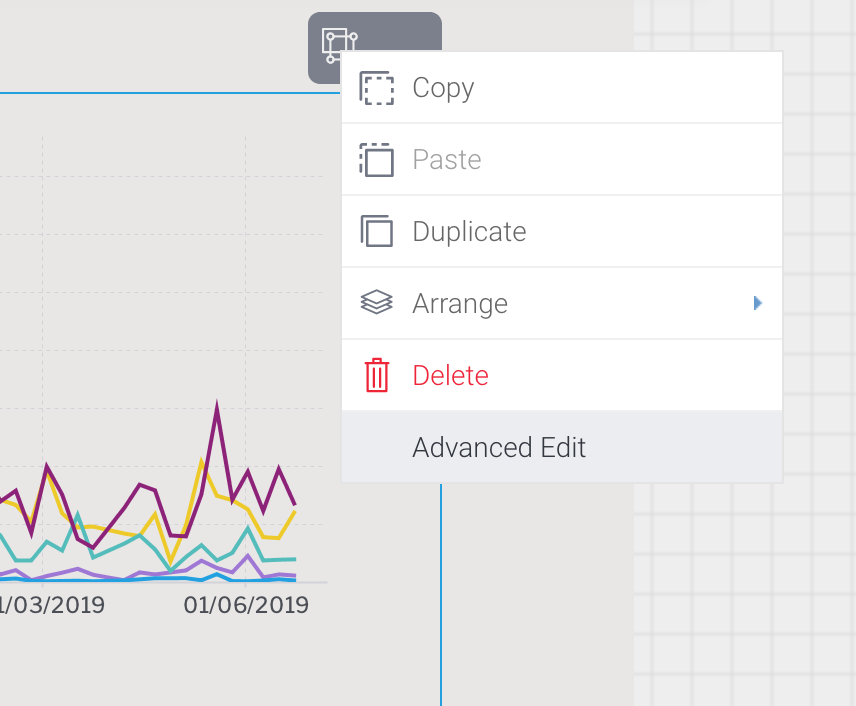
For scenarios that involve advanced configuration, Quick Charts now includes Advanced Edit which takes the visualization through our powerful report and chart builder - and when you’re done, immediately bringing you back to the dashboard with a single click - keeping you in the flow.
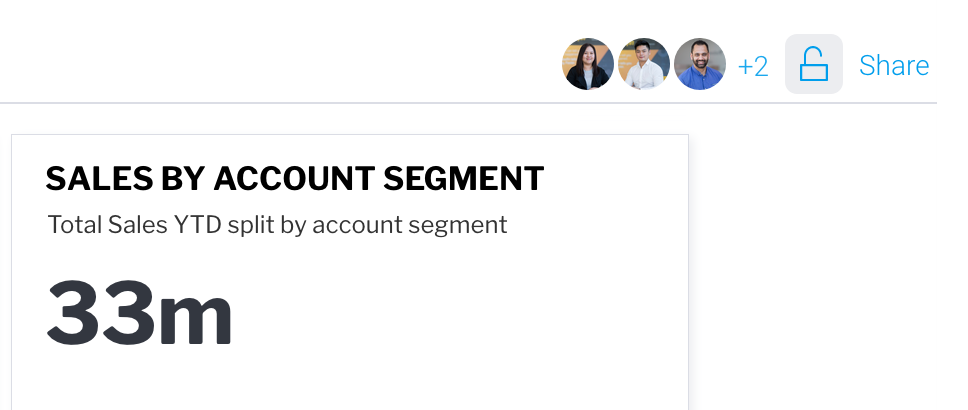
We have also simplified dashboard sharing by enabling you to set security permissions and share recipients without editing the dashboard.
In Yellowfin 9, Dashboard Code Mode gave dashboard builders and software developers the ability to integrate actions and extend the capability of their dashboards using familiar coding languages. In this 9.1 release, we have introduced new configurations and role functions to ensure developer code for Code Mode within dashboards and presentations are secure and editable only by trusted users.
Data Storytelling
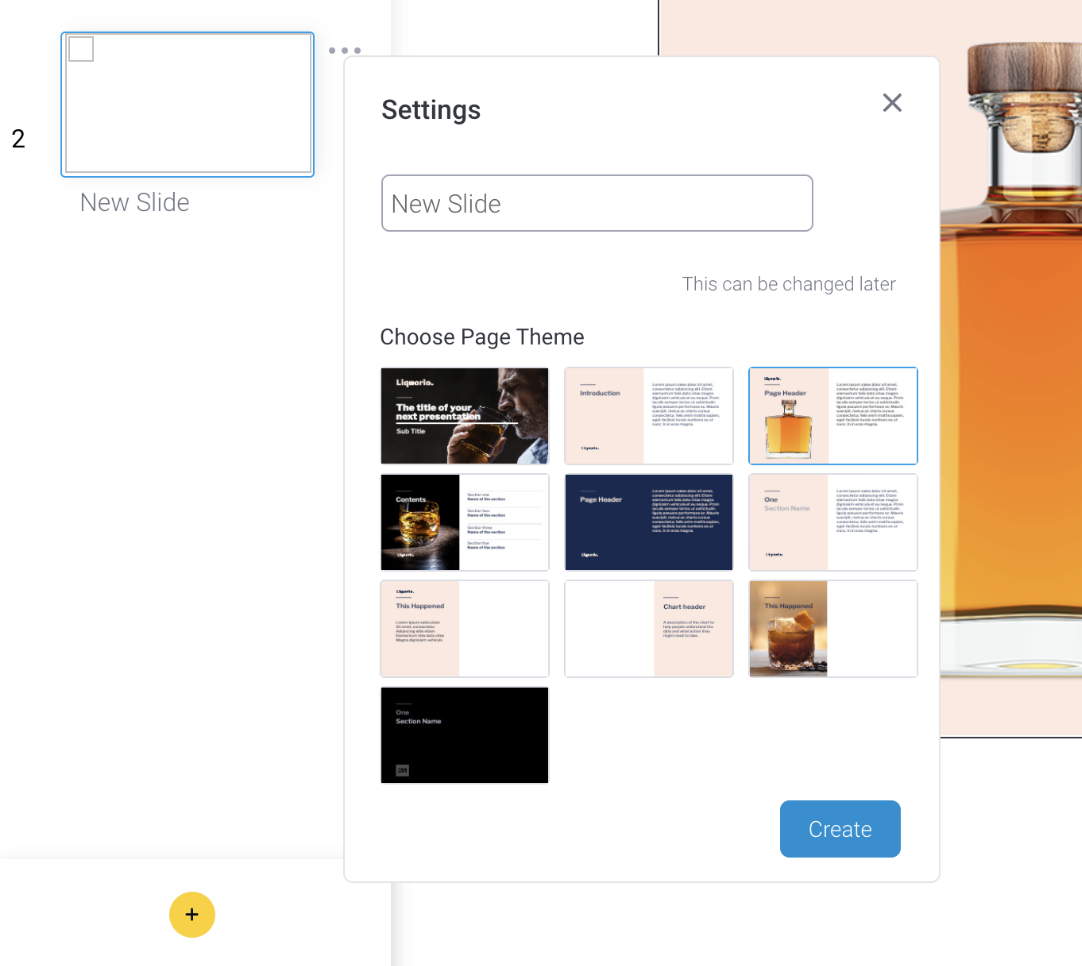
With Yellowfin Present, you can create and share compelling, governed data presentations using live and static reports, videos, text and more. In 9.1, you now have the option to apply Themes to your presentations - slides that are designed upfront and saved as Present Themes - allowing other storytellers to reuse them for different presentations or individual slides.
Data Discovery
Action Buttons, introduced in Yellowfin 9, allow you to trigger events and perform custom workflows on dashboards. Due to popular demand, action buttons are now also available on your reports through an Action Button Formatter.
You can customize report action buttons to perform internal Yellowfin actions like opening another report/dashboard tab or external actions like opening a URL to another app. If you have a status column in your report that updates upon the completion of said action, you can use its data values to drive button states.
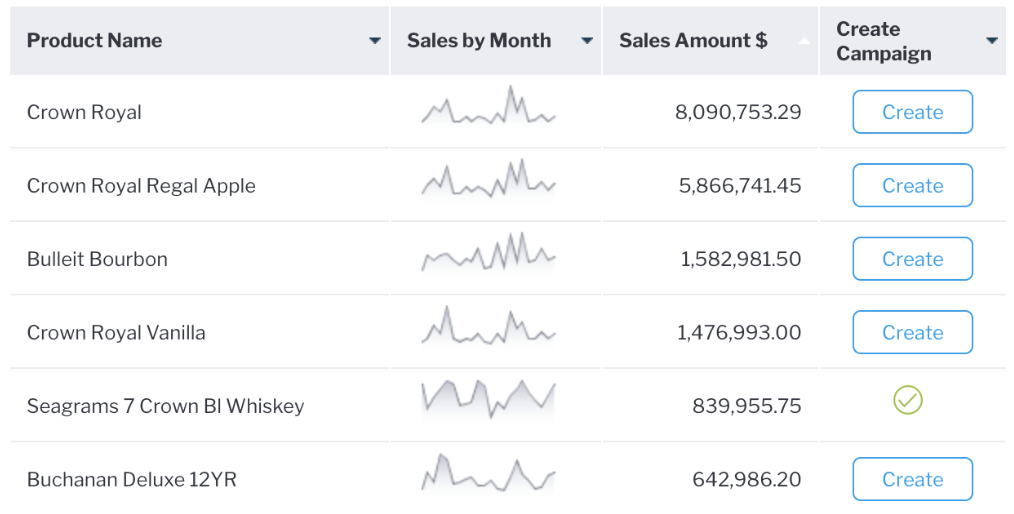
We have also included a new Sparkline Advanced Function and Formatter in this release, providing a new visual way to convey business performance and data trends in your reports.
See it in action
Check out the video below to see some of these new enhancements in action:
For a full list of enhancements in Yellowfin 9.1, visit our What’s New page and discover how the latest release provides business users with unique ways to engage with and act on their data, and addresses the needs of data analysts and developers who want to build and deploy amazing analytical experiences.