
Analytics Beyond Reporting: How Embedded BI Drives Executive Action

Most executives are drowning in dashboards but starving for insights. We’ve been conditioned to view "analytics" as a rear-view mirror, a report on what happened, rather than a steering wheel for what should happen next. Traditional BI creates a "reporting tax," where scaling insights requires a proportional increase in data analyst headcount to interpret the noise. This article explores how analytics beyond reporting is achievable through embedded analytics, specifically via YellowfinBI, transforming data into a proactive driver of action. It allows organizations to scale their intelligence without hiring more people.
The Mental Block: Why Executives Struggle to Move Beyond Dashboards
Many decision-makers struggle to visualize how a chart leads to a transaction or a strategic shift. They see data as a destination rather than a trigger. This creates a "So What?" gap. The traditional belief is that more data requires more experts. This leads to "integration silos" and "manual discovery fatigue." The return on investment of a BI tool is often consumed by the salary costs of the team needed to run it. To achieve true speed-to-value, analytics must be embedded directly into the operational workflow. This removes the context-switching that kills executive momentum.
Automated Discovery: Replacing Manual Analysis with Yellowfin Signals
From Passive Monitoring to AI-Driven Alerts
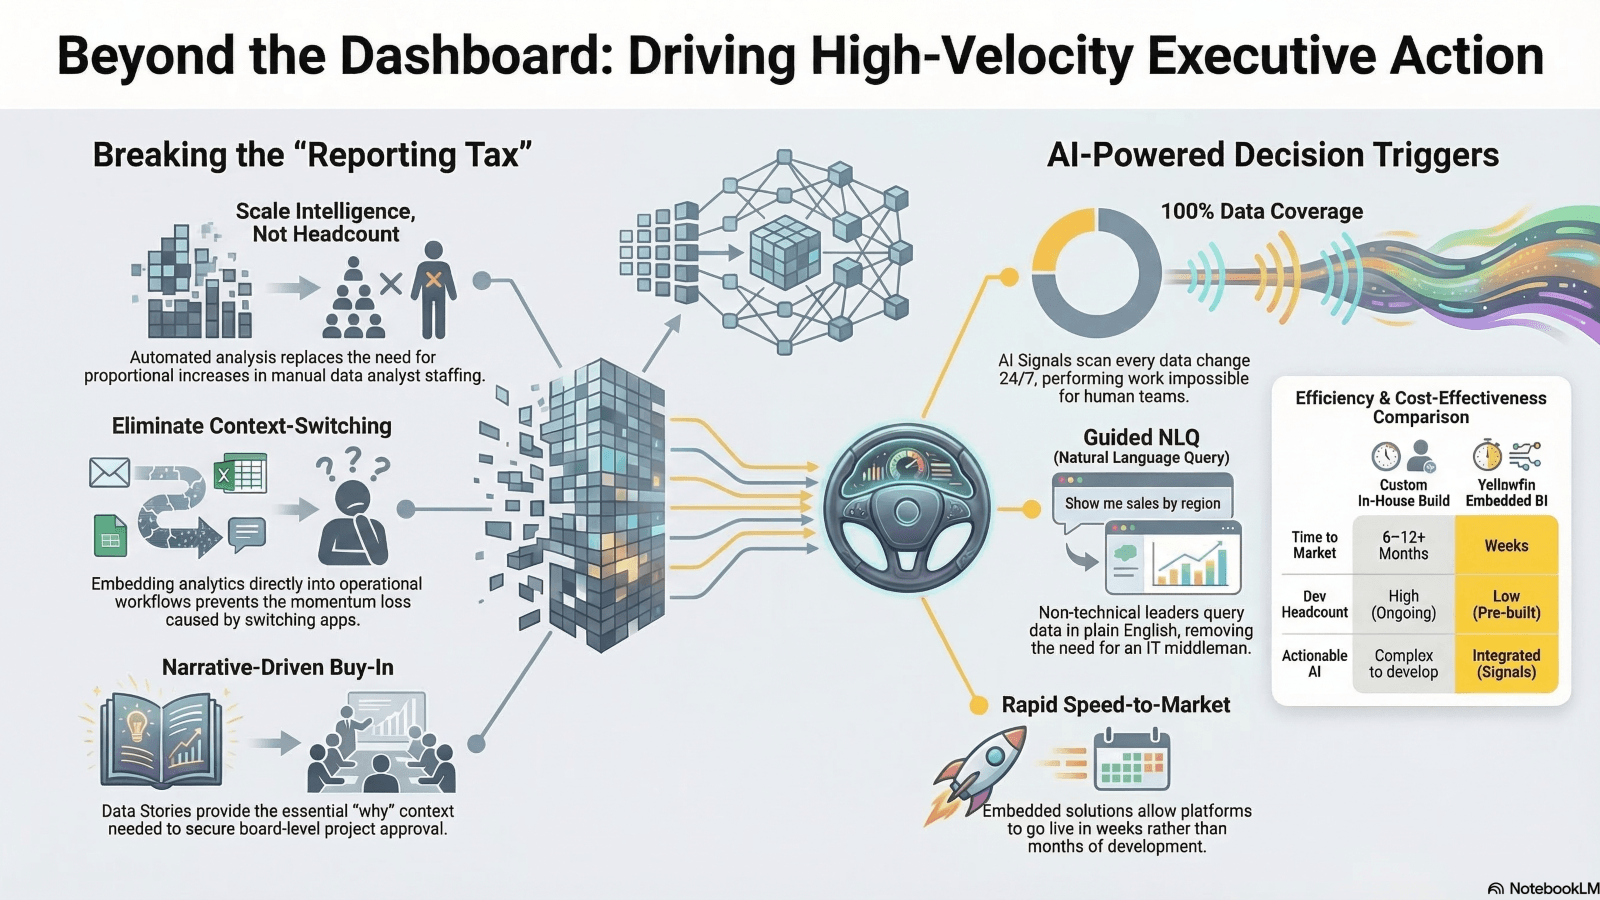
There is controversy around AI reliability versus human intuition. Some fear false positives. However, Yellowfin Signals automates the "discovery" phase of data analysis. This specifically addresses the headcount issue. Signals scans data for anomalies and trends 24/7. It performs the work of multiple junior analysts.
Bridging the Visualization-to-Action Gap
Real-time alerts function as decision triggers. Instead of waiting for a monthly report, a CEO receives a notification about a sudden drop in product usage or a spike in churn. This enables immediate intervention. This automated analysis contrasts with manual reporting. Yellowfin Signals automates discovery, saving client salaries equivalent to internal analysts. It processes 100% of data changes. A human team cannot physically achieve this.
Natural Language Querying (NLQ): Empowering the Non-Technical C-Suite
Conversations with Data Without the SQL Middleman
Many tools claim "self-service" BI. This is often not the case. Most require a basic understanding of data structures. Yellowfin’s NLQ allows a CTO or CEO to ask, "Why did our margins drop in the Midwest last week?". They receive a guided, accurate answer. This requires no ticket for the data team. Non-technical users can now query data for decisions without IT.
Retaining Context for Complex Decisions
The "Guided" aspect of Yellowfin’s NLQ helps non-technical users. It avoids the pitfalls of inaccurate query results common in basic search-based BI. This approach translates plain English into complex SQL queries automatically. This scales analytics access without hiring. It retains conversation context for complex decisions.
Data Storytelling: Closing the Logic Gap for Faster Buy-In
Narrative Over Raw Numbers
Yellowfin Data Stories combine visuals with long-form text. This addresses the executive struggle of "picturing" the action. A story explains why a metric matters. It provides the narrative context for a board to approve a pivot or a budget increase. This addresses the gap between insights and operational actions. It provides the "Why" and "What next," not just the "How much."
Automating Recurring Executive Updates
Data storytelling scales reporting. It eliminates the need for analysts to spend hours building PowerPoint decks. This automates recurring executive updates. For instance, a product team integrated Data Stories for client overviews. This replaced analyst-led PDFs. It saved dev time. It scaled to hundreds of users. CEOs visualized analytics as a decision engine via NLQ insights. This cut headcount needs.
The ROI of Embedded Analytics vs. Custom Builds
Choosing between building an analytics solution in-house versus using a vendor like Yellowfin involves significant considerations, particularly concerning cost and time-to-market.
| Feature | Custom In-House Build | Yellowfin Embedded BI |
| Time to Market | 6–12+ Months | Weeks |
| Dev Headcount | High (Ongoing maintenance) | Low (Pre-built components) |
| Actionable AI | Complex to develop | Integrated (Signals) |
| Security/Compliance | Manual implementation | Enterprise SSO/SSL Ready |
Embedded BI reduces dev time to market by months compared to scratch builds. This allows for faster monetization of features. The upfront costs of a vendor exist. However, the long-term "salary tax" of building and maintaining custom BI is significantly higher.
Scaling Sustainably: Security and Infrastructure Without the Overhaul
White-Label Security in Regulated Verticals
Security is paramount in regulated sectors like finance and healthcare. Yellowfin provides tight controls. These controls allow for pervasive BI across departments. They do this without exposing sensitive cores. Concerns over data leaks are addressed through multi-tenant security architectures and SSO integration. This enables pervasive BI without per-department hires.
Reducing the Support Burden on Engineering
Non-dev content creation uses drag-and-drop builders. Business users can create their own "action pipelines." This prevents taxing the CTO’s engineering resources. This reduces the dev support burden for analytics without hiring more engineers. The drag-and-drop content creator allows business analysts to build what they need without coding.
Conclusion: Moving from Reporting to Revenue
Analytics beyond reporting is a strategic shift, not just a technical upgrade. By using automation, NLQ, and storytelling, Yellowfin helps your current team do more with less. It turns your data from a cost center into a monetization engine. I encourage you to watch the Yellowfin Walkthrough. Evaluate your current "speed to action" metrics.
- How does Yellowfin turn static dashboards into real-time action triggers for executives? Through AI-driven "Signals" that alert users to anomalies the moment they happen.
- Can embedded analytics like Yellowfin scale to hundreds of users without adding data analysts? Yes, by helping non-technical users with NLQ and automated discovery.
- What risks do executives face trusting AI Signals over manual reporting? The controversy of "false positives" is mitigated by Yellowfin’s guided feedback loops that refine AI accuracy over time.
- How does Yellowfin's NLQ help non-technical CEOs query data for decisions without IT? It uses a "Guided" approach that translates plain English into complex SQL queries automatically.
- Why choose white-label embedding over custom BI development for cost control? It slashes time-to-market. It eliminates the need for an internal team to maintain the BI infrastructure.
- How does Data Storytelling address the gap between insights and operational actions? It provides the "Why" and "What next," not just the "How much."
- What security controversies arise when embedding BI in regulated apps? Concerns over data leaks are addressed through multi-tenant security architectures and SSO integration.
- Can Yellowfin reduce dev support for analytics without hiring more engineers? Yes, the drag-and-drop content creator allows business analysts to build what they need without coding.
- How does automated analysis save headcount while spotting trends executives miss? It processes 100% of data changes, something a human team cannot physically achieve.
- What's the ROI debate: Vendor pricing vs. building action-oriented analytics in-house? While vendors have upfront costs, the long-term "salary tax" of building and maintaining custom BI is significantly higher.