

Beyond Static KPIs: Leveraging Augmented Analytics for Predictive Business Growth
In volatile markets, a KPI dashboard that only tells you what happened last week is already too late to guide confident action. Many companies have dashboards. Fewer have KPI systems that help them spot revenue shifts, retention risk, margin pressure, or supply-chain trouble before those issues hit the business hard.
That gap is where augmented analytics comes in. Gartner defines augmented analytics as a category that uses machine learning and natural language to help people prepare, analyze, and explain data faster, with less manual work. See Gartner's definition of augmented analytics for a simple overview.
The shift is practical. Predictive KPI forecasting turns metrics into decision tools, not static scorecards. It gives teams a way to act before a problem grows. This article covers three parts of that shift. First, how predictive KPI systems work. Second, how AI-augmented scenario planning helps leaders test choices before they commit. Third, how to connect leading indicators to business outcomes that matter.
Yellowfin fits well here. Its real-time dashboards, AI-written insights, Signals, Stories, and conversational analytics help teams move from raw data to action faster.
From Backward-Looking KPIs to Predictive KPI Systems
Why traditional dashboards are useful, but incomplete for modern decision-making
Traditional KPI dashboards still matter. They give teams a shared view of revenue, cost, service levels, and other core measures. They also keep basic reporting consistent across functions. But static KPI reporting has clear limits.
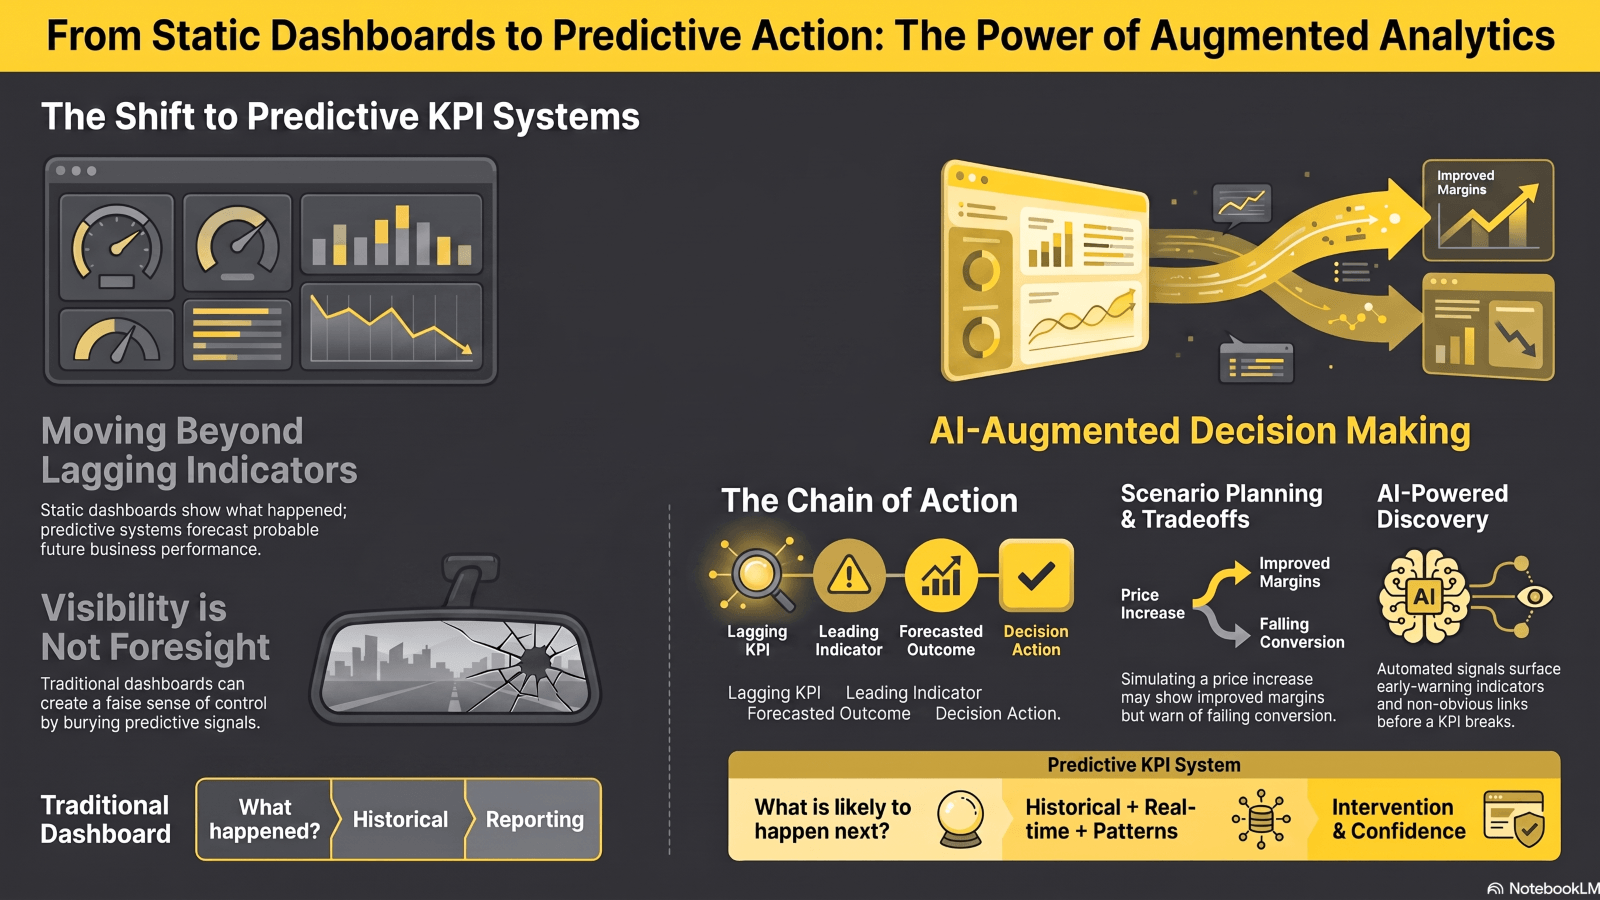
First, lagging indicators only show what already happened. Revenue last month is useful, but it does not tell you where the next dip will come from. Second, visibility can get mistaken for foresight. A clean dashboard can create a false sense of control. Third, KPI overload can bury the few metrics that really predict outcomes.
Executives do not need more metrics. They need metrics that point to probable future business performance. That is where predictive decision-making matters. McKinsey has written often about the value of analytics in decision-making and the gap between data access and action. Their insights on analytics-driven decision-making are a useful reference point.
The real job of the KPI stack is not just reporting. It is helping leaders see which signals matter next.
What predictive KPI forecasting looks like in practice
Predictive KPI forecasting is a KPI system shaped by AI, trend detection, anomaly detection, and forecasting models. It tracks current performance and also the chance of future outcomes.
That changes the dashboard from a rearview tool into a forward-looking measurement framework.
A few examples make this clear:
- Revenue can be forecast from pipeline velocity and deal stage movement.
- Churn risk can be predicted from usage drops and weaker engagement.
- Staffing risk can be estimated from absenteeism, workload spread, and overtime patterns.
This is where Yellowfin is useful in day-to-day work. Signals detect changes and outliers in real time. Ask Yellowfin lets users explore questions in plain language. Assisted Insights explains why a number moved, not just that it moved.
A good way to think about this is a short chain:
Lagging KPI -> Leading indicator -> Forecasted outcome -> Decision action
That chain is the difference between reporting and action.
| Dimension | Traditional KPI Dashboard | Predictive KPI System |
| Primary question | What happened? | What is likely to happen next? |
| Data orientation | Historical | Historical + real-time + pattern-based |
| Metric design | Static and descriptive | Dynamic and probabilistic |
| Decision value | Reporting | Forecasting and intervention |
| Business outcome | Awareness | Action confidence |
AI-Augmented What-If Scenario Planning for Executives
Scenario planning is not just a modeling task. It is a leadership habit. It helps leaders ask, "If we take this action, what else changes?" That matters when a pricing move, hiring freeze, or supply decision can ripple through the rest of the business.
AI makes scenario work faster than manual spreadsheet analysis. It can run more paths, test more inputs, and compare outputs in less time. That gives leaders more confidence before they commit capital, change headcount, alter pricing, or shift product plans.
Deloitte often writes about scenario planning and resilience. Their material on business resilience and scenario analysis is a useful starting point for teams building this muscle.
The main gain is simple. Leaders can compare plausible futures before they act. That reduces guesswork.
The business variables AI can simulate at speed
AI-augmented analytics can test many common business variables:
- Pricing changes and margin movement
- Demand spikes or declines
- Staffing changes and service levels
- Churn sensitivity and retention actions
- Supply-chain disruption and delivery delays
The value is not only in the first-order result. It is in the second-order effects.
A price increase may improve margin, but conversion may fall. A hiring freeze may cut near-term cost, but churn or SLA misses may rise later. A change in ad spend may lift demand, but CAC may also rise if the market gets noisy.
Yellowfin supports this workflow in a few ways. Interactive dashboards show current actuals. AI-written insights explain changing patterns. Stories help leaders see the scenario, the risk, and the likely tradeoff in one place.
IBM's work on predictive analytics and what-if analysis offers a useful external view on this topic.
| Scenario | Primary KPI Impact | Secondary Risk | Decision Use |
| Raise prices by 8% | Margin up | Conversion down | Test elasticity before launch |
| Reduce support staffing | Cost down | Churn up / SLA down | Validate service thresholds |
| Increase ad spend | Demand up | CAC may rise | Improve acquisition efficiency |
| Delay inventory replenishment | Cash up | Stockout risk | Balance working capital and fill rate |
Connecting Leading Indicators to Business Outcomes
Not every visible metric has value. Some metrics are just noise. Others point to what comes next.
Leading indicators should tie to business outcomes, not vanity reporting. That means analysts need to find the few measures that actually move revenue, retention, margin, or growth.
Useful methods include:
- Correlation analysis
- Pattern detection
- Cohort behavior review
- Trend decomposition
Examples are easy to spot once teams look for them:
- Product usage frequency may predict retention.
- Quote turnaround time may predict conversion.
- Inventory turnover may predict cash flow.
- Sales activity mix may predict pipeline quality.
The point is not to fill dashboards with more tiles. The point is to find the signal under the noise.
AI does not replace business judgment. It speeds up pattern discovery. That matters when the metric set is large and the relationships are not obvious.
Augmented analytics can surface:
- Non-obvious links between metrics
- Early-warning indicators before a KPI breaks
- Segments where the same action has different results
That lets analysts spend more time testing meaning and less time hunting for the next chart.
Yellowfin fits this work through Signals, Stories, and embedded analytics. Signals spot shifts in real time. Stories explain which leading indicators matter. Embedded analytics puts those findings inside the tools teams already use.
Harvard Business Review has long covered the value of data-driven decisions. Its data topic page is a good place to explore that broader context.
| KPI Noise to Signal Funnel |
| Many metrics |
| Fewer meaningful leading indicators |
| Smallest set of predictive KPIs |
| Business outcomes |
How to Redesign KPIs So They Become Decision Tools, Not Reporting Tools
A predictive KPI system does not start with a dashboard. It starts with a business outcome.
Use this simple sequence:
- Start with the business outcome.
- Identify the measurable drivers.
- Validate which drivers are leading indicators.
- Apply forecasting and scenario modeling.
- Monitor continuously and recalibrate.
That keeps the work tied to the business, not to chart count.
Dashboards still matter. They just need to be smarter. Good governance also matters. Teams should define metric ownership, data freshness, threshold rules, and alert logic. Without that, even strong analytics can drift into noise.
Where Yellowfin fits in the operational model
Yellowfin supports this shift with live dashboards, AI NLQ, Assisted Insights, Signals, and Stories. Yellowfin 9.17 adds more AI-powered features for quick, back-and-forth exploration. Ask Yellowfin and Code Assistant help teams get answers faster, even without SQL. Embedded analytics brings predictive intelligence into products and internal workflows.
That matters for both internal teams and product teams. It keeps decisions close to the work.
For teams looking to modernize their stack, Yellowfin 9.17 and its AI-driven features can drive faster chart creation and exploration. Tools like Ask Yellowfin and Code Assistant answer questions in plain language and provide answers without requiring long setup cycles.
Meanwhile, for anyone comparing platforms, The Power BI Alternative: Yellowfin Migration Guide is a good place to get a good understanding.
Conclusion: Predictive KPI Forecasting Turns Analytics into a Competitive Advantage
Leaders do not need more dashboards. They need KPI systems that help them see what comes next.
Predictive KPI forecasting changes the job of analytics in three clear ways. First, predictive KPI systems shift reporting from backward-looking to forward-looking. Second, AI-augmented scenario planning gives leaders more confidence before they act. Third, leading indicators cut through noise and keep attention on outcomes that matter.
The next step is simple. Audit the current KPI stack. Ask whether the metrics support forecasting, intervention, and alignment. If they do not, the dashboard is still just a report.
Yellowfin gives teams a practical path forward with real-time dashboards, AI-powered insights, Signals, Stories, and embedded analytics. Watch the webinar, try Yellowfin, request a demo, or subscribe for more AI and analytics updates.