

Conversational Analytics in 2026: Where Natural Language Search Helps
In 2026, asking a BI tool, “What happened to revenue last quarter?” feels almost effortless. That ease is the appeal of conversational analytics. It turns plain language into charts, metrics, and short explanations. It sits inside the broader world of augmented analytics, where AI helps people ask better questions and move faster.
But speed can hide problems. If the metric is vague, the calendar is wrong, or access rules are loose, a fast answer can still be the wrong answer. That matters for finance, operations, and leadership reporting.
This guide gives a practical view of where natural-language search helps, where it misleads, and why classic dashboards still matter. The main point is simple. Conversational analytics should act as a front door to governed data, not a replacement for enterprise BI.
Yellowfin is moving in that direction. Its latest release adds conversational analysis that creates charts and graphs on the fly. Its AI Chatbot Assistants help users ask questions inside the platform and get faster answers.
What does conversational analytics actually do in an enterprise BI stack?
Conversational analytics, also called natural-language query or NLQ, lets someone ask a question in plain language and get a chart, metric, or written response. A dashboard works differently. It shows pre-modeled, curated, and governed views of performance.
That difference matters.
Conversational analytics is strong when people want to explore. Dashboards are stronger when teams need repeatable reporting and clear accountability. One helps users ask new questions. The other gives everyone the same view of the business.
The best BI stacks use both. That matters in large firms, where people have different skill levels and different needs. A sales manager may want quick answers. A finance lead may want a fixed KPI set. A product analyst may want both.
Gartner has long tied augmented analytics to faster insight discovery in BI modernization, while Microsoft describes self-service BI as a way to let business users work with trusted data without waiting on every request. See Gartner Analytics & BI research.
Why Yellowfin users care in 2026
Yellowfin users do not need another AI toy. They need a workflow that saves time and keeps control.
That workflow often looks like this:
- Ask a question.
- Inspect the chart.
- Read the AI explanation.
- Share the result in a story.
That flow fits sales, finance, operations, and customer support. A regional sales team can check which territory slipped. Finance can inspect margin movement. Support can look for ticket spikes. Leaders can get context without waiting for a hand-built report.
This is the practical value of assisted analysis. It speeds up self-service. It lowers dependency on analysts for first-pass questions. It also helps teams tell cleaner data stories for leadership.
For Yellowfin’s AI chart generation, the 9.17 release page shows the direction clearly.
Where do conversational analytics help the most?
The strongest use case for conversational analytics is fast discovery.
A leader asks, “What changed?” A manager asks, “Which region underperformed?” A controller asks, “How did this compare to last month?” These are natural questions. They do not need SQL. They need context.
That is why executives tend to like conversational analytics. They want a quick read on the business, not a long setup. They need a starting point for the next question.
Used well, NLQ cuts the gap between curiosity and action. It gives a first answer fast, then pushes the user toward the right follow-up.
Guided exploration for analysts
Analysts benefit too, but in a different way. Conversational tools can speed up the early part of analysis.
They help analysts:
- slice by region, product, or segment
- build first-pass visuals
- spot anomalies before deeper review
That saves time on routine setup. It leaves more time for interpretation.
Yellowfin fits this pattern well with Ask Yellowfin, Assisted Insights, and Stories and Presents for packaging findings. Analysts can ask, test, explain, and present inside one flow.
That matters because insight only has value when others can use it.
Where conversational analytics fails and why that matters
Natural language is messy. Business language is messier.
A user says “revenue.” Does that mean booked revenue, recognized revenue, or net revenue? A user says “last quarter.” Does that mean calendar quarter or fiscal quarter? A user says “top customers.” Top by revenue, growth, margin, or renewal rate?
A conversational tool can answer with confidence even when the question is vague. That is the risk. If the semantic model is thin, the answer may look right and still be wrong.
This is a serious issue in finance and executive reporting. A clean chart can hide a bad definition. A friendly chat response can mask uncertainty. That is why NLQ needs governance underneath it.
The worst failure mode is not just bad answers. It is inconsistent answers.
If five people ask the same business question in five different ways, they may get five different outputs. That happens when metric definitions are loose, datasets are duplicated, or query logic differs across teams.
The result is predictable:
- metric sprawl
- duplicate definitions
- shadow dashboards
- trust erosion
DAMA’s Data Management Body of Knowledge and IBM’s data governance overview both point to the same basic idea. Shared meaning matters. Without it, self-service becomes self-conflict.
Governance, accuracy, and permissioning: the non-negotiables
Conversational analytics is only as strong as the layer below it.
That means:
- semantic modeling
- governed metrics
- data quality controls
- lineage and auditability
If those pieces are weak, AI adds speed to confusion. If those pieces are strong, AI helps people find answers faster.
Yellowfin works best as a governed BI layer, not as a chat window over random tables. Certified data sources and curated KPI definitions give the AI something stable to work with. They also give users a clear path back to trusted logic.
Yellowfin’s webinar on sovereignty of your data analytics stack covers this control point well.
Permissioning and row-level security in conversational BI
Enterprise BI has a hard rule. Users only see what they are allowed to see.
That rule still applies when a user types a question in plain language. A chatbot cannot ignore role-based access. It cannot skip row-level security. It cannot join sensitive data just because the prompt sounds harmless.
The risks are real:
- prompt-based data leakage
- overbroad joins
- exposure of sensitive segments
Security should live in the data layer, not only in the interface. NIST access control guidance and OWASP’s Top 10 for Large Language Model Applications both point to the same issue. Interfaces can fail. Controls must sit below them.
Conversational analytics vs dashboarding: when to use each
Use conversational analytics for:
- exploration
- triage
- ad hoc questions
Use dashboards for:
- monitoring
- recurring reporting
- board-level decisions
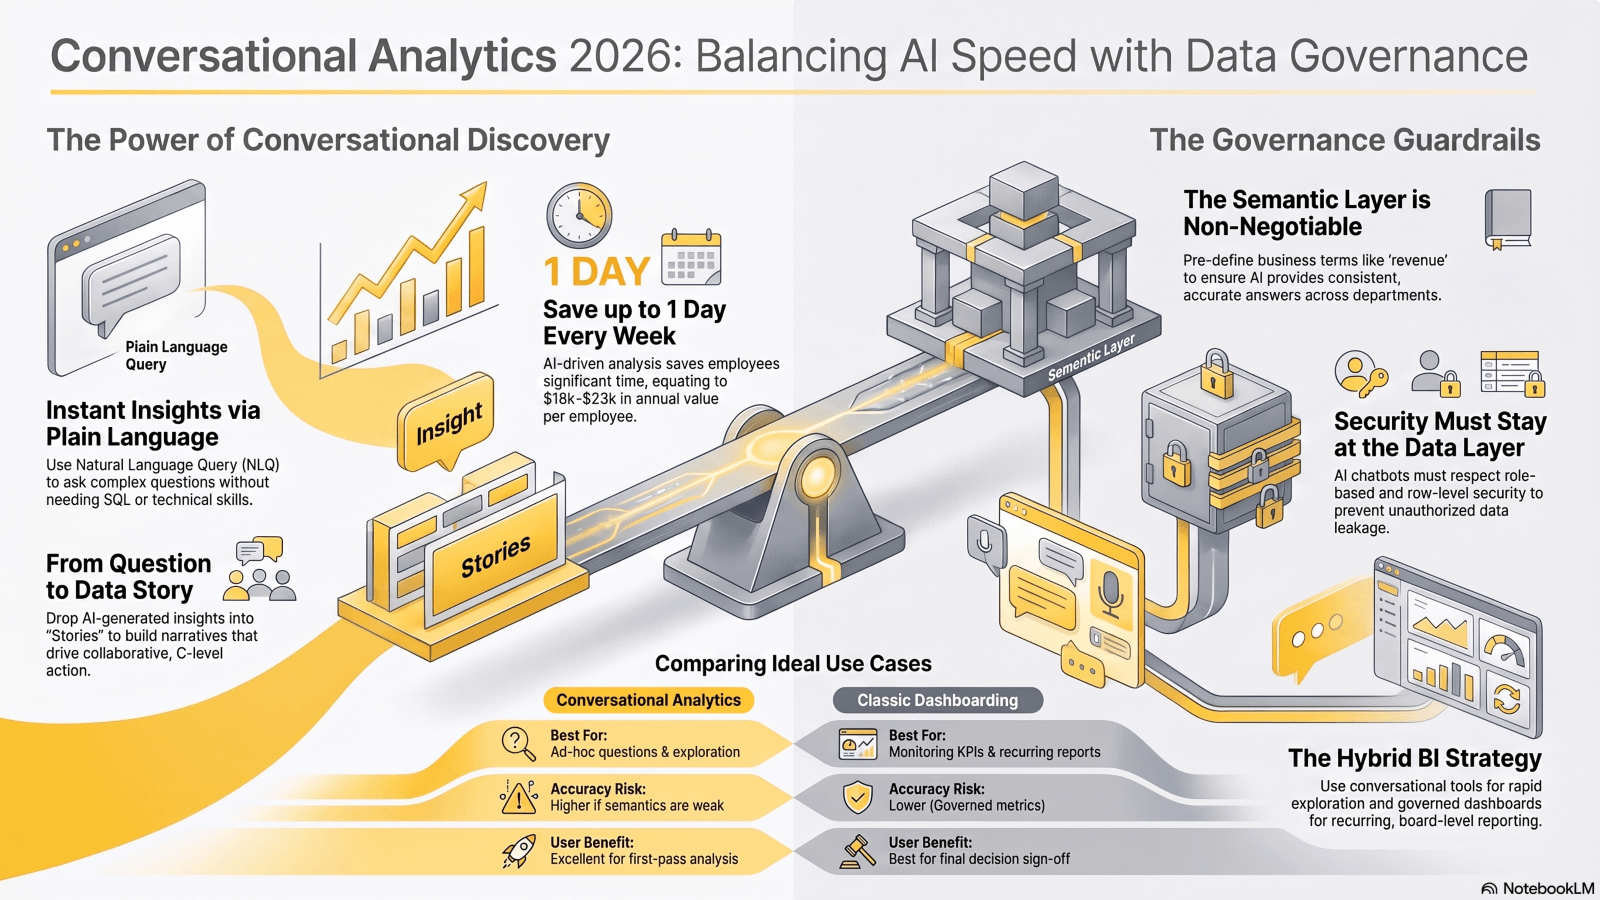
That split is practical. Dashboards create shared truth. Conversational analytics speeds inquiry. One should not replace the other.
A simple comparison table
| Capability | Conversational Analytics | Classic Dashboarding |
| Best for | Ad hoc questions, exploration | Monitoring KPIs, recurring reporting |
| Speed to answer | Fast | Fast for prebuilt views |
| Accuracy risk | Higher if semantics or governance are weak | Lower if metrics are governed |
| Permissioning | Must be enforced centrally | Usually enforced through model and access rules |
| Executive confidence | Good for context and follow-up | Best for decision sign-off |
| Analyst efficiency | Excellent for first-pass analysis | Excellent for standardized reporting |
Yellowfin’s dashboards, stories, and AI NLQ fit this split well. The platform gives teams one place for both inquiry and reporting.
How to implement conversational analytics responsibly in Yellowfin
Start with governed metrics, not freeform prompts. Do not roll out NLQ on top of loose definitions.
Start with a semantic layer. Build a metric dictionary. Certify the datasets that matter most. Define common business terms before broad adoption.
That cuts ambiguity. It also cuts rework. Users trust answers more when the terms stay stable.
Design for human review and escalation
Not every AI answer should drive action on its own.
For high-stakes decisions, pair the answer with the chart and the source. Route critical findings to analysts for review. Use Yellowfin Stories and Presents to package validated insights for leadership.
That workflow gives speed without losing control.
Yellowfin’s AI Chatbot Assistants and 9.17 release fit well here. They give people a fast start, then keep the path open for review.
Practical rollout checklist for YellowfinBI teams
- Define governed KPIs and business terms
- Restrict access with role-based and row-level permissions
- Test conversational queries against known business questions
- Monitor query drift, mismatch rates, and user trust issues
- Route high-impact decisions to curated dashboards and analyst review
If this list feels strict, good. It should. Conversational analytics works best when it sits inside rules, not outside them.
Conclusion – Use conversational analytics to accelerate decisions, not replace governance
Conversational analytics works when it removes friction. It helps users ask better questions. It speeds up exploration. It widens access to data.
But it also has clear limits. Ambiguity, inconsistent definitions, and permissioning gaps can turn fast answers into bad decisions. That is why it cannot stand alone.
The strongest enterprise analytics stack combines AI-powered natural-language search, governed dashboards, collaborative stories, and enterprise-grade security. That is the Yellowfin model in practice.
Next steps:
- Watch the On-demand Webinar: Take back control over the sovereignty of your data analytics stack
- Learn more about Yellowfin 9.17
- Explore Ask Yellowfin and Code Assistant
- Download The Power BI Alternative: Yellowfin Migration Guide