

What Are Embedded Data Visualization Tools?
Data visualization is a core element and key capability of embedded analytics.
Embedded data visualization tools create real-time visualizations (charts, graphs, etc) and can be embedded into any software application or integrated into a cloud or standalone app, and provides every user quick and easy ways to visualize information.
This article explores the benefits of using embedded data visualization tools in your applications, and discusses how it can improve upon the traditional analytics experience.
Embedding data visualization into your app
Embedded analytics, also known as embedded BI, is the process of integrating data analytics into your existing business software applications and processes.
With this model, analytical capabilities, such as data visualization, are not in a separate, standalone application, but rather they exist as a part of your everyday business.
An example of embedded analytics is an insurance company’s claims processing system. An embedded analytics solution might integrate data from that system with your main accounting system, aiming to provide better risk management and claims-handling reporting with rich data visualization that gives users more insight and visibility into the claims process, and a way to make informed decisions about risk and profitability.
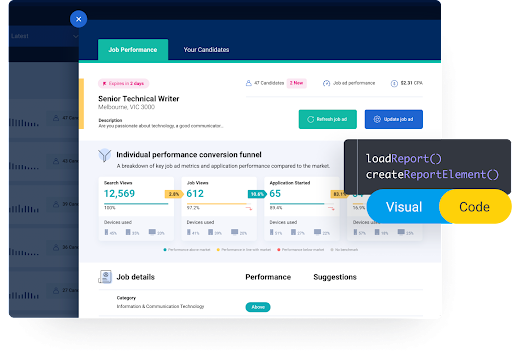
Data visualization refers to using data to show information in a way that can be understood by the viewer. Data visualization is also a technique that can be used for presenting data. The data presentation can be in the form of a chart, list, maps, and makes information more accessible and meaningful for the viewer. Data visualization tools in embedded analytics platforms create a visual display of data in your app, typically through a dashboard, and can shows how data is related to your processes.
Benefits of Embedding Data Visualization Tools
Embedded analytics visualization capabilities can be accessed in the business application it is integrated with from any device with a data connection.
Your users can create real-time visualizations without the need for specific data formats or third-party solutions external and separate from the applications they use for work. It's built-in, which means data analysis becomes a bigger part of everyday workflows.
Any application with embedded analytics visualization built-in will show insights to business users as they’re moving through their day-to-day activities. It provides data at key points throughout the workday, allowing decision-makers to take more informed action.
Embedded analytics tools also enable data experts to get insights into their data more quickly and effectively. With these tools, data scientists can create and run automated reports to provide more timely, actionable insights. Embedded analytics is typically implemented as part of an existing business process.
Once again, let's take an example of the claims processing system in an insurance company. The system processes all claims submitted by customers. This can include asking the questions of whether the claims are valid. The system could also send out messages to customers about the status of their claims. All of these processes are great examples of how embedded analytics work inside a business process.
Learn more: 5 Benefits of Modernizing Your Application’s Analytics with Embedded Analytics
Why Embedded Data Visualization Tools are Better Than Traditional Analytics
There are several points why you should immediately migrate from traditional analytics to modern embedded data visualization tools.
Interactive Data Visualization
You already know that data visualization is an essential part of any data analysis process. Without it, you will not be able to gain insights from a wide variety of data.
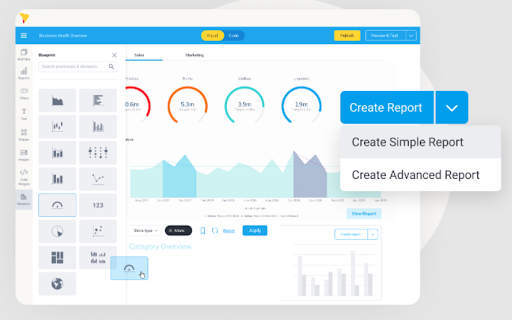
Data visualization tools such as Yellowfin's Embedded Analytics enable you to create dynamic and stunning visualizations of your data in a variety of formats. These visualizations can quickly and easily be deployed across the Web and shared with your stakeholders in real-time. Yellowfin offers beautiful visualization types in the form of graphics, bar charts, tables, text and typography, JavaScript charts, maps, images, and shapes. You can also combine different data forms in a canvas and visualization library.
Minimal Cost to Change and Reduced Effort
Unlike traditional analytics tools, embedded analytics software is easy to use and cost-effective. This makes data visualization, along with many other advanced analysis capabilities, more accessible for organizations with limited budgets and resources.
Embedded analytics also allows you to implement data visualization on a larger scale without requiring specialized technical skills. You don't need to have expertise in database management or programming languages to begin creating charts and graphs.
This makes embedded analytics visualization tools ideal for organizations that want to leverage their existing technology stack. Organizations and product managers can also use embedded analytics to scale their application up and become more competitive.
Ongoing Project Support and Scalability
Embedded analytics vendors like Yellowfin offer ongoing support and scalability, and its streamlined solutions enable businesses to start with small analytics projects and grow them over time. For example, you can start with a basic dashboard that provides key metrics and insights on your products.
Over time, you can add more complex analytics content and visualize them with embedded analytics tools. For example, you can track your brand’s overall reputation by combining customer survey results with social media conversations. You can also monitor customer sentiment on your brand's Facebook page.
On the other hand, if you use a traditional BI tool for data visualization, it may be difficult to extend its functionality to a wide range of business areas. Moreover, you need to hire additional resources or build custom applications. With Yellowfin's advanced analytical capabilities, however, you can build upon the existing platform by simply extending its functionality or adding new features.
Easy Modernization
You don’t need to learn a new set of tools to add embedded analytics software into your existing legacy BI tools and applications. You simply need to update the software code behind your application.
With embedded analytics, you can seamlessly upgrade the software that is running in the background. The process doesn't require significant downtime or interruption of services. This is because Yellowfin knows how important 24/7 service is for many industries such as healthcare and finance.
Advanced Functionality at Low Cost
You don’t need to spend a lot of money on specialized hardware or create dedicated data scientists and analysts for embedded analytics tools.
The low price makes it ideal for organizations with limited budgets and resources. Yellowfin's embedded analytics also supports data scientists and application developers who want advanced features such as automation and machine learning capabilities.
This is why embedded analytics tools are often preferred by large organizations with sophisticated analytics requirements for additional features.
Why should you try Embedded Analytics Data Visualization?
Yellowfin is a modern embedded analytics data visualization tool designed to work with existing business processes. The software provides valuable insights and actionable recommendations to decision-makers.
Yellowfin’s key features also enable you to create responsive charts of your data, whether it’s internal or external. It can quickly create interactive dashboards to help you make more informed decisions. If you're looking for a business application that will integrate with your existing applications, you should try out Yellowfin now.
How to Create Stunning Dashboards and Reports with Yellowfin Data Visualization
Data visualization is at the core of communicating information effectively. Learn how the Yellowfin embedded analytics suite can help you build compelling, data-led, action-based dashboards, reports, and presentations.