

What is data storytelling? The value of context & narrative in BI
Storytelling is a fundamental human skill, yet using data to tell stories is still an emerging concept. Understanding its purpose is key to making the most of your analytics today.
By 2025, Gartner predicts data stories will be the most widespread way of consuming analytics. Data storytelling is a part of modern analytics you can’t afford to overlook.
However, are you still unsure of what data storytelling is, or why there's a sudden buzz?
This blog acts as a beginner’s guide to what data storytelling means for your company’s business intelligence and data analytics, explains the importance of leveraging it today, and how Yellowfin’s own set of storytelling tools can enrich your insight reporting efforts.
What is data storytelling?
Data storytelling describes the capability to convey important information and critical insights from data using a combination of textual and visual narrative techniques.
It's a skill that helps provide context and deeper understanding around metrics in a report or dashboard, inspire your audience to act, and aid the decision-making process.
Think of it as another effective way to share how your business is performing, and motivate others to care about a discovery, when the numbers alone can't.
Today, there are two types of fundamental approaches to storytelling in organizations:
1. Traditional reporting: A formal packaging of data on a regular basis (daily, monthly, quarterly) that presents what’s happened, how it's happened and why it’s happened. It highlights what’s done in a period to plan for the next, mostly based on just the numbers.
2. Influencing story: Text-focused styles of reporting (presentations, informal emails, long-form narratives with images/video) that help persuade people to make decisions in a certain way, using both the data and bigger picture (context) to justify their next action.
Traditionally, operational reports and dashboards were considered to be the best way to tell a story about business performance or a discovery, but the reality is they only provide numbers. People still have to analyze and interpret said numbers to understand what it means for the business, which can be complex if they're non-technical or lack context.
Using the influencing story format to tell a story with data is a better way to share data points, curate them with a story, and explain what it actually means for the business and why the next course of action is decided upon. By adding narrative to reporting, you can provide added context, insight and interpretation that makes metrics more meaningful.
How does data storytelling add value to BI?
A ‘data story’ in some ways, may be an inaccurate name. After all, a story is never just about the data; it merely acts as the trigger for creating a story, or as the foundation to anchor a narrative. But if the narrative itself is approached as just a straightforward description of what the data shows, its value for decision-makers can be limited.
This is where context comes in.
Context around the data is what empowers a data story’s narrative from being just a collection of metrics to a valuable decision-making tool. By placing contextual information, such as your expert opinion and past experience, around a data story, it makes the numbers more relevant to those in the business that make strategic decisions which cannot draw on data alone (unlike simpler operational decisions in areas such as production lines that are more reliant on real-time data via operational reporting).
Above all else, context adds a much needed layer of emotion to the narrative surrounding your data. Exciting, inspiring, surprising and even alarming decision-makers with the details behind the numbers. Context is key, and having an analytics solution that allows you to create data stories that help bring valuable 'big picture' information to the forefront of your reporting will only further benefit your decision-makers long-term.
Understandably, storytelling and context isn’t always something that comes naturally or is first in mind for many business users when using analytics for their day-to-day reporting needs. This is why it’s important to continue to champion the value of providing narrative context around insights sooner rather than later, and improve data literacy
This is where BI platforms that support data storytelling within their tools come in handy.
Read More: How to create a data culture through data storytelling
What does data storytelling mean as an analytics feature?
When used in the context of analytics solutions, data storytelling describes the specific narrative-building capabilities of a business intelligence (BI) and analytics platform that enable its users to communicate the importance of specific data to different audiences.
These tools help people build a story around an important insight which can engage the audience emotionally, provide depth of understanding to a topic, and back up their understanding with data to drive better action (decision-making) on what to do next.
Embedded analytics platforms today offer several narrative-building features which combine real-time data with rich information presentation options without having to switch to using other tools. One such vendor pushing this area of analytics is Yellowfin.
Yellowfin's data storytelling capability is unique in that it allows users to combine data and narrative to build impactful, data-driven reports and presentations. We've found business users prefer to consume data stories rather than looking at data; they want variations in the data discovered, explained and interpreted for them. Dashboards don't do that, and this is why data stories are effective. They can be used internally, or as insights-as-a-service for your customers (benchmark analysis, industry trends, etc).
What are Yellowfin's Data Storytelling tools?
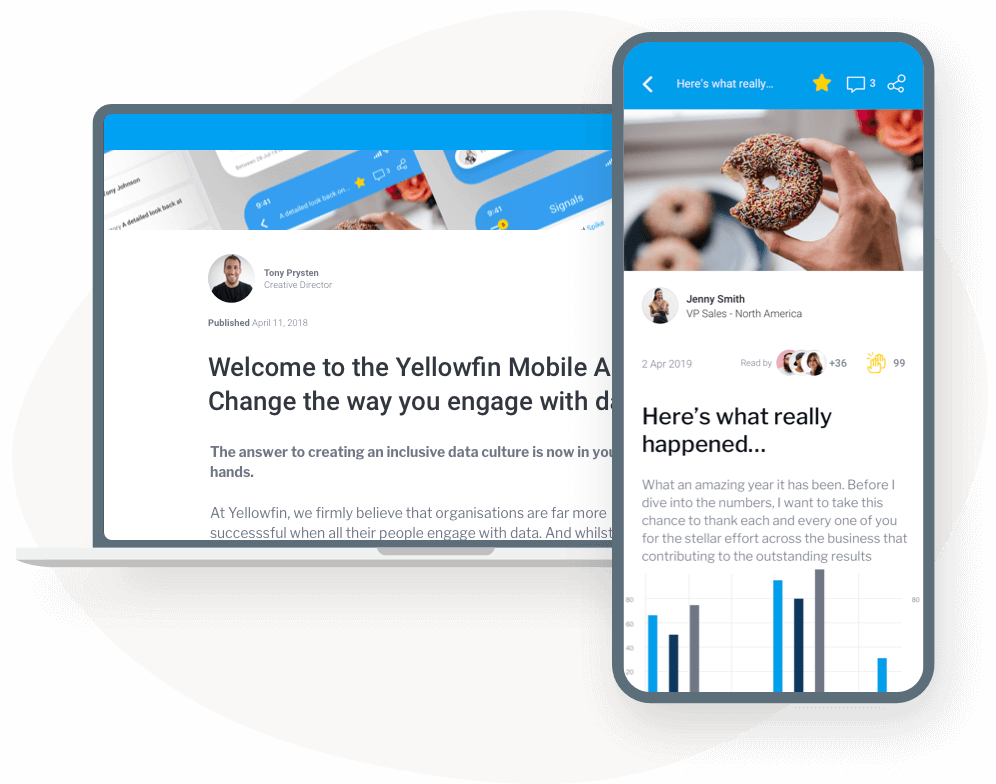
Yellowfin Stories is an in-built tool that allows analytics users to write and share their data insights in a news-like, blog-style format and designed for long-form narratives; instead of just a dashboard, detailed aspects of the business can be presented as a written report or journalistic piece with rich accompanying narrative techniques (images, visualizations, etc) underpinned by data. Monthly reports, company updates, and strategy are some examples of what can be shared and enhanced using this format.
Yellowfin Present is a fully integrated presentation module that lets users communicate important data and insights, complete with interactive widgets, live reports, images, text, shapes, icons, filters and actions as part of a slide deck. Present is great for when you need to stand in front of a crowd and take a boardroom or department through key data and help them better understand the context behind the numbers with a relatable story.
Why is data storytelling so important in analytics today?
The fact is traditional operating reports and dashboards used on their own rarely provide the full necessary context for the data they share, resulting in differing interpretations.
Data storytelling and analytics platforms with tools specifically made to build narrative around data like Yellowfin Stories not only help users provide better context to the numbers, but help collect information in one place so people can agree on its meaning, and align on the next (and preferably most) appropriate action to take moving forward.
The entire reason behind wanting to share data is because an insightful discovery has been made. You want to facilitate the best course of action, so being able to share your findings in an engaging way is a capability you need from the analytics you adopt. Hence, the importance of finding the right solution that gives you the tools to tell your next story.
Next steps: See what data storytelling looks like in Yellowfin BI in our walkthrough video
The whole reason behind wanting to share data is because a discovery has been made. See how you can build better, more engaging narratives around the numbers and facilitate the best course of action with Yellowfin Stories.