

What are the Top Data and Analytics Trends and Benefits for 2026
How does augmented analytics really benefit your organization? We break down its many practical advantages in usability, time-savings and value it unlocks across the entire analytics life cycle.
Augmented analytics uses emerging technologies like automation, artificial intelligence (AI), machine learning (ML) and natural language generation (NLG) to automate data manipulation, monitoring and analysis tasks and enhance data literacy.
In our previous blog, we covered what augmented analytics actually is and what it really means for modern business intelligence. In this article, we focus on helping you learn the many practical benefits that augmented analytics can bring to your business, across the three core pillars of the analytics lifecycle: preparation, analysis and insight delivery.
 Automatic Data Profiling: Automatic profiling can recommend the best approaches to cleaning, enriching, manipulating and modelling data; combined with the team’s existing knowledge, this can fundamentally improve data management (cataloguing, metadata, data quality) and help teams continuously refine their data preparation processes. As an example, Yellowfin Data Prep provides automated recommendations to best fix or curate data as part of its Suggest Actions feature.
Auto-detection for less repetition: Augmented data preparation can handle mundane, routine but necessary data transformation steps, like physically joining schemas together or comparison calculations, with automation. Algorithms auto-detect schemas and join data from different sources together, without the need for manual intervention.
Streamlined data harmonization: Augmented data preparation enables admins to integrate more data sources, from ad-hoc, external or trusted sources, using automation and machine-led algorithms, faster than using traditional harmonization approaches. An example of augmented data preparation from Gartner details a business in the Consumer Packaged Goods (CPG) sector who originally required five people to access, clean, blend, model and integrate data across various data systems (point-of-sale, pricing, Nielsen) which took five weeks. Augmented data preparation reduced this process to one person and one hour, with one click-updates.
Automatic Data Profiling: Automatic profiling can recommend the best approaches to cleaning, enriching, manipulating and modelling data; combined with the team’s existing knowledge, this can fundamentally improve data management (cataloguing, metadata, data quality) and help teams continuously refine their data preparation processes. As an example, Yellowfin Data Prep provides automated recommendations to best fix or curate data as part of its Suggest Actions feature.
Auto-detection for less repetition: Augmented data preparation can handle mundane, routine but necessary data transformation steps, like physically joining schemas together or comparison calculations, with automation. Algorithms auto-detect schemas and join data from different sources together, without the need for manual intervention.
Streamlined data harmonization: Augmented data preparation enables admins to integrate more data sources, from ad-hoc, external or trusted sources, using automation and machine-led algorithms, faster than using traditional harmonization approaches. An example of augmented data preparation from Gartner details a business in the Consumer Packaged Goods (CPG) sector who originally required five people to access, clean, blend, model and integrate data across various data systems (point-of-sale, pricing, Nielsen) which took five weeks. Augmented data preparation reduced this process to one person and one hour, with one click-updates.
 Automated visualizations: Analysts can leverage automated visualizations for their analysis efforts; these contextualized visualizations are automatically generated using the machine learning capabilities of augmented analytics based on the best fit options for representing said metrics. This saves analysts a lot of time and also assists them in deeper understanding of data.
Continuous ‘always on’ analysis: Machines now make it possible to have analysis set to be always running monitoring and analysis of data. If it finds a type of change (spike, volatility), it will auto-analyze an anomaly and bring it to the surface, as opposed to relying on analysts to spend considerable time looking for every single instance of relevant change and potentially missing it due to lack of time or data fatigue.
Reduced analytical bias: Analysts always make assumptions when trying to find answers (we have to start somewhere). Augmented analytics can help reduce bias by running automated analysis across a bigger range of data, with a focus on factors of statistical importance, broadening future search efforts. By applying automated analysis in parallel with the analyst’s manual oversight, the risk of missing important insights is reduced.
Time-to-insight: Rather than having to manually test all possible combinations of data, analysts can apply sophisticated ML algorithms to auto-detect hidden correlations, clusters, outliers, relationships and segments. The most statistically significant findings are presented via smart visualizations, optimized for the analyst’s further interpretation and action. This helps specialists examine highly pertinent insights in more depth and provide more detail when they pass data to users - it’s also a lot faster. As a real-world example of the practical impact of using augmented analysis, Yellowfin’s augmented analytics features (Signals, Assisted Insights) enabled aviation manufacturer AeroEdge’s analysts to identify hidden patterns that lead to manufacturing issues and address them 80% faster. This also increased cost awareness for the operators in charge of analyzing data, which led to further identified opportunities to improve business profitability.
Read More: Augmented analytics: 3 key advantages for vendors
Automated visualizations: Analysts can leverage automated visualizations for their analysis efforts; these contextualized visualizations are automatically generated using the machine learning capabilities of augmented analytics based on the best fit options for representing said metrics. This saves analysts a lot of time and also assists them in deeper understanding of data.
Continuous ‘always on’ analysis: Machines now make it possible to have analysis set to be always running monitoring and analysis of data. If it finds a type of change (spike, volatility), it will auto-analyze an anomaly and bring it to the surface, as opposed to relying on analysts to spend considerable time looking for every single instance of relevant change and potentially missing it due to lack of time or data fatigue.
Reduced analytical bias: Analysts always make assumptions when trying to find answers (we have to start somewhere). Augmented analytics can help reduce bias by running automated analysis across a bigger range of data, with a focus on factors of statistical importance, broadening future search efforts. By applying automated analysis in parallel with the analyst’s manual oversight, the risk of missing important insights is reduced.
Time-to-insight: Rather than having to manually test all possible combinations of data, analysts can apply sophisticated ML algorithms to auto-detect hidden correlations, clusters, outliers, relationships and segments. The most statistically significant findings are presented via smart visualizations, optimized for the analyst’s further interpretation and action. This helps specialists examine highly pertinent insights in more depth and provide more detail when they pass data to users - it’s also a lot faster. As a real-world example of the practical impact of using augmented analysis, Yellowfin’s augmented analytics features (Signals, Assisted Insights) enabled aviation manufacturer AeroEdge’s analysts to identify hidden patterns that lead to manufacturing issues and address them 80% faster. This also increased cost awareness for the operators in charge of analyzing data, which led to further identified opportunities to improve business profitability.
Read More: Augmented analytics: 3 key advantages for vendors
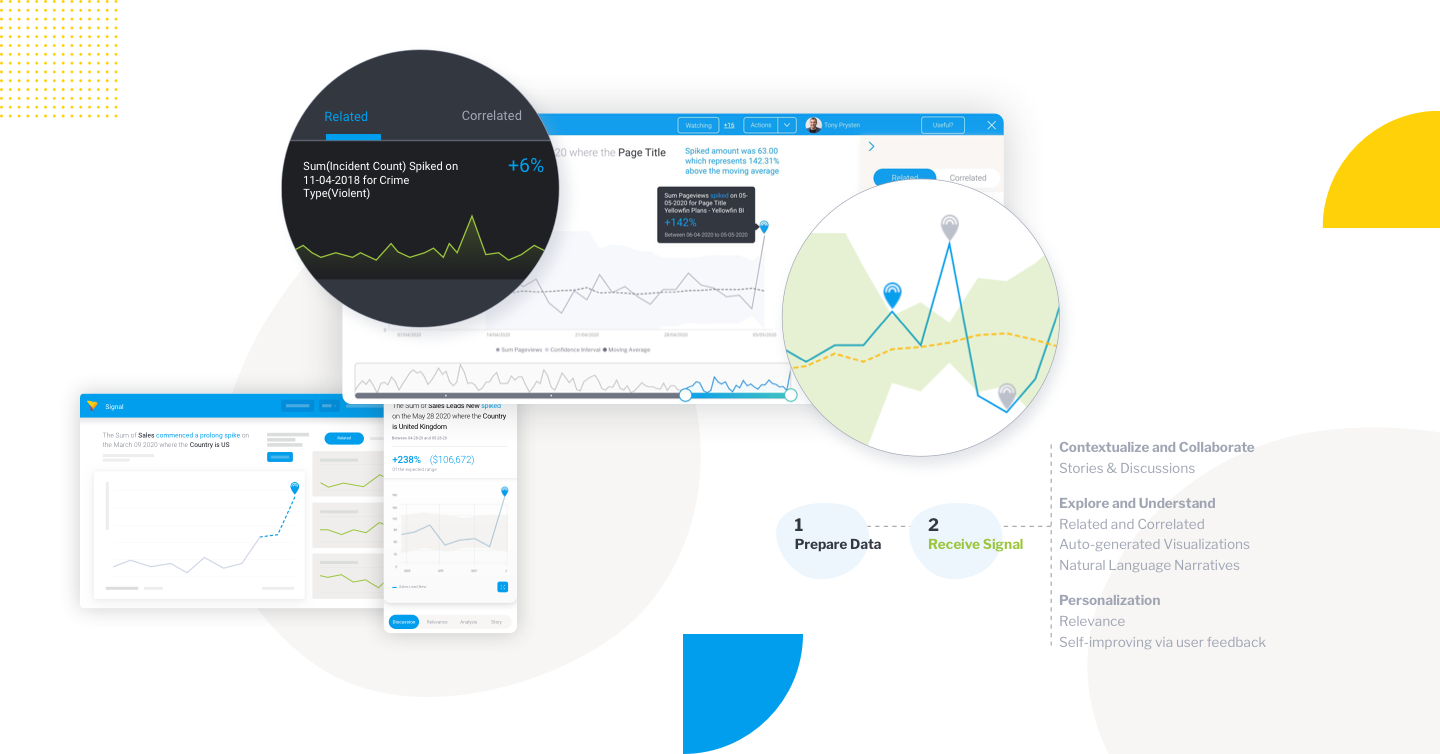
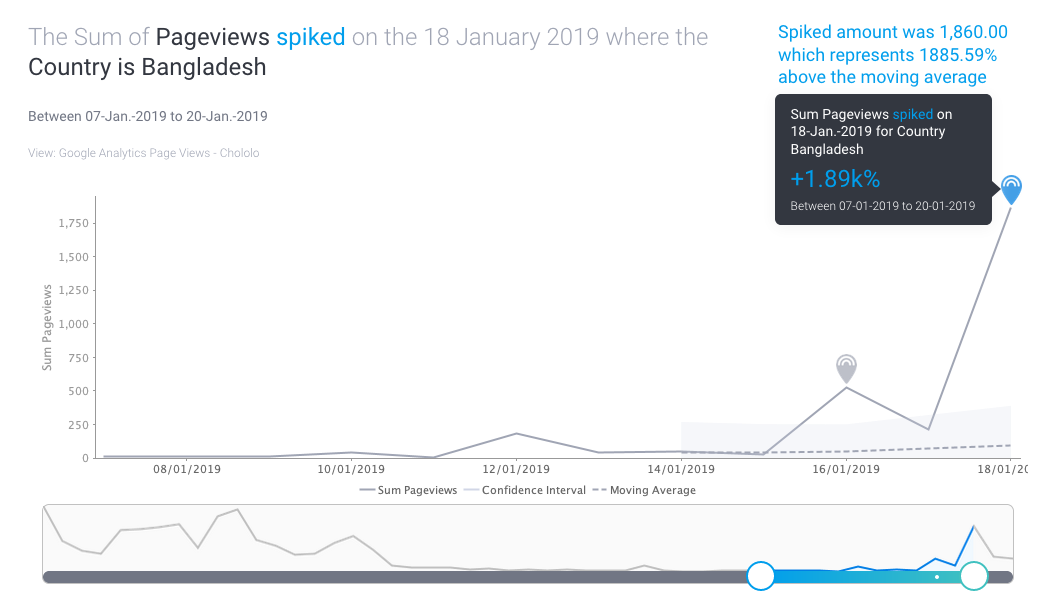
 Predictable discovery: The automated and machine-led capabilities of augmented analytics never get tired of exploring all possible combinations of data, aren't biased, and can alert users to meaningful changes right as they happen, including outliers that might not always be evident when users manually view highly aggregated dashboard or charts. They help provide reliable findings into potential issues or insights that regular analysis can’t always guarantee, and reduce the need for users to seek additional intervention from analysts. For example, our Yellowfin digital team had pre-built dashboards in Google Analytics to provide aggregated overviews of traffic to our website.. Sometimes, anomalies were hard to ascertain for regular users from the aggregated visualizations. So we set up Yellowfin Signals to automate the monitoring, alerting and analysis of unexpected spikes in page-views. We instantly received automated alerts that Signals’ automated analysis determined paid ads were from countries where we weren’t running any paid campaigns (or so we thought). Signals drove the immediate conversation with our ad agency in which we discovered our agency made a mistake and did not limit our paid ads to the locations we had chosen. Without Signals and Yellowfin’s augmented insight delivery capabilities, it would be like trying to find that data ‘needle’ beneath a highly aggregated dashboard. Augmented analytics help to ensure these types of hidden insights are consistently brought to the surface.
Instant, explained answers: Augmented insight delivery features like Assisted Insights leverage NLG to dynamically generate high-level explanations and comparisons that break down findings in a way that users of varying knowledge can understand. Coupled with auto-generated visualizations, variance analysis and calculation creation, this gives an instant, visual understanding when they query their data. Most importantly, it helps improve the user’s data literacy, encouraging further data-driven decision-making and data-led cultures as a whole.
Personalized insights: Ranking algorithms learn the more users interact with their analytics tools, and rank what’s most relevant over time. With this sort of augmented capability in place, users can better understand exactly what critical areas of their business metrics they should be looking at, and be assured that their automated BI is delivering them more pertinent information to analyze over time, which also gradually opens up otherwise unseen avenues of insight.
Predictable discovery: The automated and machine-led capabilities of augmented analytics never get tired of exploring all possible combinations of data, aren't biased, and can alert users to meaningful changes right as they happen, including outliers that might not always be evident when users manually view highly aggregated dashboard or charts. They help provide reliable findings into potential issues or insights that regular analysis can’t always guarantee, and reduce the need for users to seek additional intervention from analysts. For example, our Yellowfin digital team had pre-built dashboards in Google Analytics to provide aggregated overviews of traffic to our website.. Sometimes, anomalies were hard to ascertain for regular users from the aggregated visualizations. So we set up Yellowfin Signals to automate the monitoring, alerting and analysis of unexpected spikes in page-views. We instantly received automated alerts that Signals’ automated analysis determined paid ads were from countries where we weren’t running any paid campaigns (or so we thought). Signals drove the immediate conversation with our ad agency in which we discovered our agency made a mistake and did not limit our paid ads to the locations we had chosen. Without Signals and Yellowfin’s augmented insight delivery capabilities, it would be like trying to find that data ‘needle’ beneath a highly aggregated dashboard. Augmented analytics help to ensure these types of hidden insights are consistently brought to the surface.
Instant, explained answers: Augmented insight delivery features like Assisted Insights leverage NLG to dynamically generate high-level explanations and comparisons that break down findings in a way that users of varying knowledge can understand. Coupled with auto-generated visualizations, variance analysis and calculation creation, this gives an instant, visual understanding when they query their data. Most importantly, it helps improve the user’s data literacy, encouraging further data-driven decision-making and data-led cultures as a whole.
Personalized insights: Ranking algorithms learn the more users interact with their analytics tools, and rank what’s most relevant over time. With this sort of augmented capability in place, users can better understand exactly what critical areas of their business metrics they should be looking at, and be assured that their automated BI is delivering them more pertinent information to analyze over time, which also gradually opens up otherwise unseen avenues of insight.
Blog Contents
hide
#1 - Augmented data preparation
Traditionally, database administrators bring critical data together from multiple sources and carefully prepare it for integration with downstream systems and analytics tools. Augmented data preparation is a component of augmented analytics that transforms this procedure to become less reliant on manual process and ensures best practices for each step of the preparation phase are followed.How augmented analytics enhances data preparation
Automatic Data Profiling: Automatic profiling can recommend the best approaches to cleaning, enriching, manipulating and modelling data; combined with the team’s existing knowledge, this can fundamentally improve data management (cataloguing, metadata, data quality) and help teams continuously refine their data preparation processes. As an example, Yellowfin Data Prep provides automated recommendations to best fix or curate data as part of its Suggest Actions feature.
Auto-detection for less repetition: Augmented data preparation can handle mundane, routine but necessary data transformation steps, like physically joining schemas together or comparison calculations, with automation. Algorithms auto-detect schemas and join data from different sources together, without the need for manual intervention.
Streamlined data harmonization: Augmented data preparation enables admins to integrate more data sources, from ad-hoc, external or trusted sources, using automation and machine-led algorithms, faster than using traditional harmonization approaches. An example of augmented data preparation from Gartner details a business in the Consumer Packaged Goods (CPG) sector who originally required five people to access, clean, blend, model and integrate data across various data systems (point-of-sale, pricing, Nielsen) which took five weeks. Augmented data preparation reduced this process to one person and one hour, with one click-updates.
#2 - Augmented analysis
Sifting through and analyzing prepared data before it is deployed to the wider business is traditionally handled by data analysts. But the vast volumes of data organizations accumulate today means it’s just not possible to look at every relevant data point from every angle in a timely manner.How augmented analysis enhances data analysis
 Automated visualizations: Analysts can leverage automated visualizations for their analysis efforts; these contextualized visualizations are automatically generated using the machine learning capabilities of augmented analytics based on the best fit options for representing said metrics. This saves analysts a lot of time and also assists them in deeper understanding of data.
Continuous ‘always on’ analysis: Machines now make it possible to have analysis set to be always running monitoring and analysis of data. If it finds a type of change (spike, volatility), it will auto-analyze an anomaly and bring it to the surface, as opposed to relying on analysts to spend considerable time looking for every single instance of relevant change and potentially missing it due to lack of time or data fatigue.
Reduced analytical bias: Analysts always make assumptions when trying to find answers (we have to start somewhere). Augmented analytics can help reduce bias by running automated analysis across a bigger range of data, with a focus on factors of statistical importance, broadening future search efforts. By applying automated analysis in parallel with the analyst’s manual oversight, the risk of missing important insights is reduced.
Time-to-insight: Rather than having to manually test all possible combinations of data, analysts can apply sophisticated ML algorithms to auto-detect hidden correlations, clusters, outliers, relationships and segments. The most statistically significant findings are presented via smart visualizations, optimized for the analyst’s further interpretation and action. This helps specialists examine highly pertinent insights in more depth and provide more detail when they pass data to users - it’s also a lot faster. As a real-world example of the practical impact of using augmented analysis, Yellowfin’s augmented analytics features (Signals, Assisted Insights) enabled aviation manufacturer AeroEdge’s analysts to identify hidden patterns that lead to manufacturing issues and address them 80% faster. This also increased cost awareness for the operators in charge of analyzing data, which led to further identified opportunities to improve business profitability.
Read More: Augmented analytics: 3 key advantages for vendors
Automated visualizations: Analysts can leverage automated visualizations for their analysis efforts; these contextualized visualizations are automatically generated using the machine learning capabilities of augmented analytics based on the best fit options for representing said metrics. This saves analysts a lot of time and also assists them in deeper understanding of data.
Continuous ‘always on’ analysis: Machines now make it possible to have analysis set to be always running monitoring and analysis of data. If it finds a type of change (spike, volatility), it will auto-analyze an anomaly and bring it to the surface, as opposed to relying on analysts to spend considerable time looking for every single instance of relevant change and potentially missing it due to lack of time or data fatigue.
Reduced analytical bias: Analysts always make assumptions when trying to find answers (we have to start somewhere). Augmented analytics can help reduce bias by running automated analysis across a bigger range of data, with a focus on factors of statistical importance, broadening future search efforts. By applying automated analysis in parallel with the analyst’s manual oversight, the risk of missing important insights is reduced.
Time-to-insight: Rather than having to manually test all possible combinations of data, analysts can apply sophisticated ML algorithms to auto-detect hidden correlations, clusters, outliers, relationships and segments. The most statistically significant findings are presented via smart visualizations, optimized for the analyst’s further interpretation and action. This helps specialists examine highly pertinent insights in more depth and provide more detail when they pass data to users - it’s also a lot faster. As a real-world example of the practical impact of using augmented analysis, Yellowfin’s augmented analytics features (Signals, Assisted Insights) enabled aviation manufacturer AeroEdge’s analysts to identify hidden patterns that lead to manufacturing issues and address them 80% faster. This also increased cost awareness for the operators in charge of analyzing data, which led to further identified opportunities to improve business profitability.
Read More: Augmented analytics: 3 key advantages for vendors
#3 - Augmented insight delivery
Finding patterns in data is like looking for a needle in a haystack. It’s not easy, nor is it a task that can always be done in a timely manner. Augmented insight delivery helps business users discover not just where the needle lies faster than what traditional manual effort can produce, but also understand what’s there and why it’s important so they can do something about it, without the traditional blockers if needed to go back and forth via the technology teams for assistance.How augmented insight delivery enhances insight discovery
 Predictable discovery: The automated and machine-led capabilities of augmented analytics never get tired of exploring all possible combinations of data, aren't biased, and can alert users to meaningful changes right as they happen, including outliers that might not always be evident when users manually view highly aggregated dashboard or charts. They help provide reliable findings into potential issues or insights that regular analysis can’t always guarantee, and reduce the need for users to seek additional intervention from analysts. For example, our Yellowfin digital team had pre-built dashboards in Google Analytics to provide aggregated overviews of traffic to our website.. Sometimes, anomalies were hard to ascertain for regular users from the aggregated visualizations. So we set up Yellowfin Signals to automate the monitoring, alerting and analysis of unexpected spikes in page-views. We instantly received automated alerts that Signals’ automated analysis determined paid ads were from countries where we weren’t running any paid campaigns (or so we thought). Signals drove the immediate conversation with our ad agency in which we discovered our agency made a mistake and did not limit our paid ads to the locations we had chosen. Without Signals and Yellowfin’s augmented insight delivery capabilities, it would be like trying to find that data ‘needle’ beneath a highly aggregated dashboard. Augmented analytics help to ensure these types of hidden insights are consistently brought to the surface.
Instant, explained answers: Augmented insight delivery features like Assisted Insights leverage NLG to dynamically generate high-level explanations and comparisons that break down findings in a way that users of varying knowledge can understand. Coupled with auto-generated visualizations, variance analysis and calculation creation, this gives an instant, visual understanding when they query their data. Most importantly, it helps improve the user’s data literacy, encouraging further data-driven decision-making and data-led cultures as a whole.
Personalized insights: Ranking algorithms learn the more users interact with their analytics tools, and rank what’s most relevant over time. With this sort of augmented capability in place, users can better understand exactly what critical areas of their business metrics they should be looking at, and be assured that their automated BI is delivering them more pertinent information to analyze over time, which also gradually opens up otherwise unseen avenues of insight.
Predictable discovery: The automated and machine-led capabilities of augmented analytics never get tired of exploring all possible combinations of data, aren't biased, and can alert users to meaningful changes right as they happen, including outliers that might not always be evident when users manually view highly aggregated dashboard or charts. They help provide reliable findings into potential issues or insights that regular analysis can’t always guarantee, and reduce the need for users to seek additional intervention from analysts. For example, our Yellowfin digital team had pre-built dashboards in Google Analytics to provide aggregated overviews of traffic to our website.. Sometimes, anomalies were hard to ascertain for regular users from the aggregated visualizations. So we set up Yellowfin Signals to automate the monitoring, alerting and analysis of unexpected spikes in page-views. We instantly received automated alerts that Signals’ automated analysis determined paid ads were from countries where we weren’t running any paid campaigns (or so we thought). Signals drove the immediate conversation with our ad agency in which we discovered our agency made a mistake and did not limit our paid ads to the locations we had chosen. Without Signals and Yellowfin’s augmented insight delivery capabilities, it would be like trying to find that data ‘needle’ beneath a highly aggregated dashboard. Augmented analytics help to ensure these types of hidden insights are consistently brought to the surface.
Instant, explained answers: Augmented insight delivery features like Assisted Insights leverage NLG to dynamically generate high-level explanations and comparisons that break down findings in a way that users of varying knowledge can understand. Coupled with auto-generated visualizations, variance analysis and calculation creation, this gives an instant, visual understanding when they query their data. Most importantly, it helps improve the user’s data literacy, encouraging further data-driven decision-making and data-led cultures as a whole.
Personalized insights: Ranking algorithms learn the more users interact with their analytics tools, and rank what’s most relevant over time. With this sort of augmented capability in place, users can better understand exactly what critical areas of their business metrics they should be looking at, and be assured that their automated BI is delivering them more pertinent information to analyze over time, which also gradually opens up otherwise unseen avenues of insight.