
Yellowfin launches Storyboard, ‘redefines’ information delivery paradigm for BI
Global Business Intelligence (BI) software vendor, Yellowfin, has announced the release of ‘Storyboard’ – a new presentation and collaboration platform for BI.
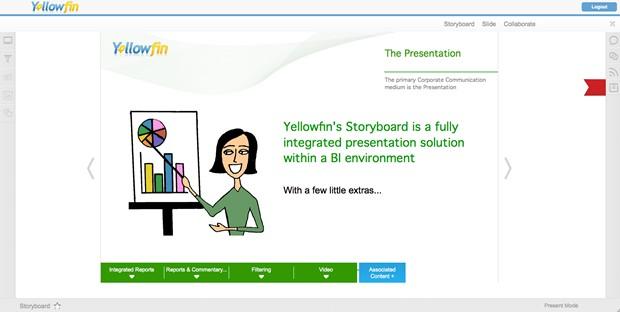
Yellowfin’s Storyboard redefines the information paradigm for communicating and acting on data, by offering a fully integrated and interactive PowerPoint-like presentation module for BI content.
Storyboard’s presentation-oriented User Interface (UI) enables the fact-based insight gleaned from BI to be naturally incorporated into organizational decision-making processes, while empowering a wider array of people from non data-centric backgrounds to share and benefit from BI.
“By blending BI with a comprehensive presentation platform, Storyboard enables users to integrate fully interactive data-rich presentations into their natural decision-making processes, to generate an analytics culture, realize ROI and drive real fact-based action,” said Yellowfin CEO, Glen Rabie.
“For the most part, the way dashboards – the status quo for visualizing analytical information – communicate and display information has remained fundamentally stagnant, failing to adapt to the shifting user base for reporting and analytics. This of course, is a big problem,” said Rabie. “Storyboard will solve the problem, and change the way people consume and act on data.”
Storyboard is fully integrated into the core Yellowfin application, and comes as part of a standard Yellowfin license. Users access Storyboard by logging into their Yellowfin instance via the browser and navigating to the Storyboard tab on the Yellowfin UI.
Storyboard: Core features and functionality
Like the core Yellowfin application, Storyboard is completely Web-based, allowing users to share and view Storyboard presentations anywhere, anytime. Being Web-based also ensures that all users, permitted to view a Storyboard, have access to one uniform version – unlike PowerPoint.
For more detail on the features and functionality of Yellowfin’s Storyboard, download the Storyboard Fact Sheet >
Rich content – such as images, graphics or video – can be added to any slide within a Storyboard. Users can also embed fully interactive Yellowfin reports to any Storyboard slide.
This feature enables users to explore their data collectively during presentations, in conjunction with supporting material, to help contextualize its significance and underpin fundamental data-based decision-making.
Reports can be explored with the full breadth of functionality offered via the core Yellowfin application.
“Storyboard is an enormously powerful tool for sharing and communicating data to people of all business backgrounds,” said Rabie. “As companies, we spend a lot of time and money working out how to capture information. Allowing people to connect to and share that knowledge is what good information management, and Storyboard, is all about. It’s about telling stories with your data.”
Applying Global Filters to a report, or set of reports, within a Storyboard allows that presentation to be viewed by multiple audiences, while ensuring they can only view the data relevant to them.
The Associated Content feature lets users add up to five secondary slides to each primary slide within a Storyboard, to help substantiate or contextualize key concepts.
Users can add entire Storyboards to a searchable list of favorites, while individual slides can be bookmarked for later reference.
Bookmark Snapshots – a static, screenshot-like image – allows users to take a snapshot of a report within a Storyboard slide for later reference, capturing the data within that report at that specific point in time.
Intuitive drag and drop, or click and swipe functionality allows reports, images, video or text to be easily maneuvered and resized to quickly create highly consumable and communicative presentations.
Additionally, Storyboards can be saved and archived for later reference. Storyboard archiving lets users update an existing Storyboard, while storing a copy of the previous and original Storyboards. And, Storyboard auto-save means that if a mistake or an unwanted addition is introduced, the presentation can be easily rolled-back to the previous version.
Each specific Storyboard presentation is auditable and securable. Users can monitor how many, and which, users have viewed each Storyboard. Access to each Storyboard can also be restricted to certain user types or individual users.
The ability to add notes and comments to slides allows users to insert complimentary ideas and information into their Storyboards. Individuals can add personal notes to Storyboard slides that only they can view. Comments can be private or public. Private Comments can only be viewed by the original author and selected individuals. Public Comments can be viewed by any user with permission to access that Storyboard.
Storyboard Distribution enables a specific Storyboard to be sent straight to the inbox of selected individuals, facilitating swift knowledge transfer and information sharing.
Users can also create their own Storyboard ‘theme’. Adding or changing slide themes within Storyboard enables presentations to be quickly and easily tailored to reflect corporate color schemes and branding. Those themes can be saved and shared with other users for effortless replication.
Addressing poor user adoption and high BI failure rates: Reimagining how key messages represented by data are communicated
Gartner has indicated that around 80 percent of BI projects fail, suggesting that only one in five BI programs are capable of positively impacting decision-making. Gartner cite poor communication and collaboration as the primary reasons.
Gartner also reported that only 28 percent of potential BI users within most organizations currently use the technology to make decisions, continuing to hamper ROI throughout 2011 and 2012. Recent research by TDWI and BIScorecard found that adoption rates languish at 24 and 25 percent respectively.
“The failure rates of BI implementations, and persistently low user adoption rates, are reflective of our inability to reimagine the way in which we communicate the key messages represented by data,” said Rabie. “According to Information Masters, 75 percent of BI success is determined by factors other than data and core analytical technology – so rethinking how data is presented, shared and discussed in order to enable effective decision–making is paramount. Storyboard addresses that need.”
Storyboard will be made publicly available as part of the latest release of Yellowfin, Yellowfin 6.2. Yellowfin 6.2 will be made generally available from 7 December 2012.
Yellowfin 6.2 will be official launched in a series of Webinars throughout Monday 3 and Tuesday 4 December 2012.
Register for the official Webinar launch HERE >
About Yellowfin
Yellowfin is a global Business Intelligence (BI) software vendor passionate about making BI easy. Yellowfin is headquartered and developed in Melbourne, Australia, offering a highly intuitive 100 percent Web-based reporting and analytics solution. Founded in 2003 in response to the complexity and costs associated with implementing and using traditional BI tools, Yellowfin is a leader in mobile, collaborative and embeddable BI as well as Location Intelligence and data visualization. For more information, visit www.yellowfinbi.com
What is Business Intelligence software?
Business Intelligence (BI) refers to a broad range of computer software applications and tools used to report, analyze and present data in a range of formats, to help businesses identify trends and opportunities, and support fundamental decision-making.
For further media information, interviews, images or product demonstration, please contact:
Lachlan James, Communications Manager on +61 03 9090 0454, 0431 835 658 or lachlan.james@yellowfin.bi
For regular updates and news, follow Yellowfin on Twitter (@YellowfinBI), LinkedIn (Yellowfin Business Intelligence), or email pr@yellowfin.bi to subscribe to Yellowfin’s free e-newsletter.