Data Visualization reveals advantage of hosting Eurovision
By Eshan Wickrema and Lachlan James
If you follow the Eurovision Song Contest, you’d probably know the nation that claims the annual title then has the privilege of hosting the following year’s event on home soil. So, can we use Business Intelligence and data visualization to assess whether compering countries actually benefit from the experience? Or does the added pressure of a home-crowd performance disadvantage the local talent?
Eurovision host country winners over time (1956 - 2014)
Insights
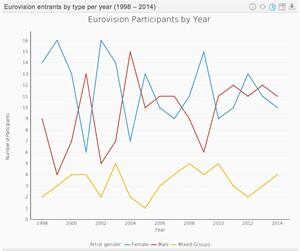
 Data visualization reveals success by gender at Eurovision >
 Data visualization ’exposes’ nudity in Game of Thrones >
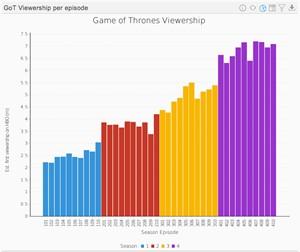
 Data Visualization reveals most popular Game of Thrones episode >
 Data Visualization: Game of Thrones the most pirated TV show >
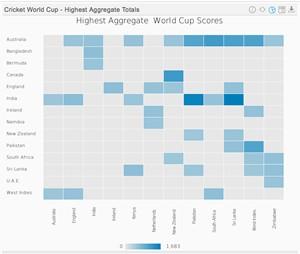
 Data viz predicts 2015 Cricket World Cup high scoring games >
 Data visualization predicts 2015 Australian Grand Prix >
 Assessing Daytona 500 championship with Data Visualization >
-
- Countries hosting the event have won six of the 59 Eurovision Song Contests to date
-
- Despite the large number of countries performing at each contest, the host nation has won nearly 10% of competitions (9.83%)
-
- There have been 59 Eurovision Song Contests held, with 62 winners awarded due to the four-way tie in 1969 (Spain, UK, Netherlands and France)
-
- Despite the large number of countries performing at each contest, the host nation has won nearly 10% of competitions (9.83%)
-
- Countries hosting the event have won six of the 59 Eurovision Song Contests to date
-
- First decade of competition, 1956 – 1965: Averaged 13.3 countries per competition, introduced 18 new countries, and had one host nation win the title
-
- Second decade of competition, 1966 – 1975: Averaged 16.9 countries per competition, introduced four new countries, and had two host nations win the title
-
- Third decade of competition, 1976 – 1985: Averaged 19.1 countries per competition, introduced two new countries, and had one host nation win the title
-
- Fourth decade of competition, 1986 – 1995: Averaged 22.9 countries per competition, introduced 11 new countries, and had two host nations win the title
-
- Fifth decade of competition, 1996 – 2005: Averaged 26.9 countries per competition, introduced nine new countries, and had no host nation win the title
-
- Sixth decade of competition, 2006 – 2015: Averaged 40 countries per competition, introduced eight new countries, and had no host nation win the title (thus far…)
 Data visualization reveals success by gender at Eurovision >
 Data visualization ’exposes’ nudity in Game of Thrones >
 Data Visualization reveals most popular Game of Thrones episode >
 Data Visualization: Game of Thrones the most pirated TV show >
 Data viz predicts 2015 Cricket World Cup high scoring games >
 Data visualization predicts 2015 Australian Grand Prix >
 Assessing Daytona 500 championship with Data Visualization >