
How Data Visualization is Used to Predict the 2016 Federal Election Winner
Whether you’re a politics enthusiast or not, Saturday’s 2016 Australian federal election is looming as a tight race, with another hung parliament seemingly a very real prospect.
While Malcolm Turnbull is undoubtedly a far more palatable Prime Minister than Tony Abbott, in the opinion of most voters, it remains to be seen whether the Coalition can shake itself free of Abbott’s gaff-prone stint in the top job.
On the other hand, given little hope of election victory in 2016 following Turnbull’s leadership coup in September last year, Opposition Leader Bill Shorten has found surprising support amongst the Labor faithful and the electorate at large in recent months.
While the Coalition has enjoyed superior primary support, with its first preference percentage outweighing Labor’s throughout the horrifyingly long election campaign, first preference voting intentions are now tightening up heading towards the finishing line.
So, who will emerge to deliver the victors speech this Saturday 2nd July? Let’s crunch the numbers using Business Intelligence software and data visualization.
Federal Voting Intention during 2016 Election Campaign
Insights
 Which Party do Voters Trust to Handle the Big Issues?
Insights
Which Party do Voters Trust to Handle the Big Issues?
Insights
-
- When Turnbull said he would call for a Double Dissolution election (April 19th, 2016), the Coalition had strong primary support – 42% compared to Labor’s 36%
-
- Polls tightened the following week as an early election became a real prospect
-
- Coalition announce 2016 Federal Budget (May 3rd, 2016) and regain ascendancy in the polls
-
- After the federal election was officially called (May 8th, 2016), the margin in first preference voting intention was maintained, despite Turnbull being named in the Panama Papers scandal (May 11th, 2016)
-
- Labor lost significant ground to minor parties and independents at the midpoint of the campaign around the beginning of June, but bounced back from a six-point gap (41% vs 35%) to tighten things up during the week (39% vs 37%)
-
- Two party preferred polling had Labor and the Coalition level pegging (50% vs 50%) as the prospect of a Double Dissolution election was tabled (April 19th, 2016)
-
- After preferences, Labor opened up a strong two party preferred lead in the following week (52% vs 48%), reflecting a tightening of first preference voting intentions during the same week
-
- The delivery of the 2016 Federal Budget (May 3rd, 2016) saw the Coalition close in on Labor in the week following the announcement (49% vs 51%)
-
- After the federal election was officially called (May 8th, 2016), the two party preferred polling remained steady, like first preference voting intentions, despite Turnbull being named in the Panama Papers scandal (May 11th, 2016)
-
- Labor’s election campaign appeared to falter heading into June, with the Coalition taking the lead in two-party preferred polling for the first time (51% vs 49%)
-
- The final month of Labor’s election campaign seems to have resonated with the electorate, tying two party preferred voting up at 50/50, with Labor then reclaiming the lead for the final three weeks of polling (51% vs 49%)
-
- The Turnbull-led Coalition enjoyed a significant honeymoon period between September 2015 and February 2016, maintaining a primary vote of 44% - 45% after Abbott was removed as Prime Minister (September 15th, 2015)
-
- During the same period, Labor couldn’t move above 35% of first preference support
-
- In August 2015, before Turnbull toppled Abbott, the ALP had emerged from the political wilderness of the 2013 federal election to lead the two party preferred polls (51% vs 49%)
-
- The electorate responded positively to Abbot’s ousting with immediate effect, with the Coalition regaining and maintaining ascendancy in the two party preferred polls from September 2015 through to February 2016 (52% vs 48%)
-
- For almost the entirety of Abbott’s time as PM, from December 2013 to September 2015, Labor led the Coalition government in two party preferred polling
-
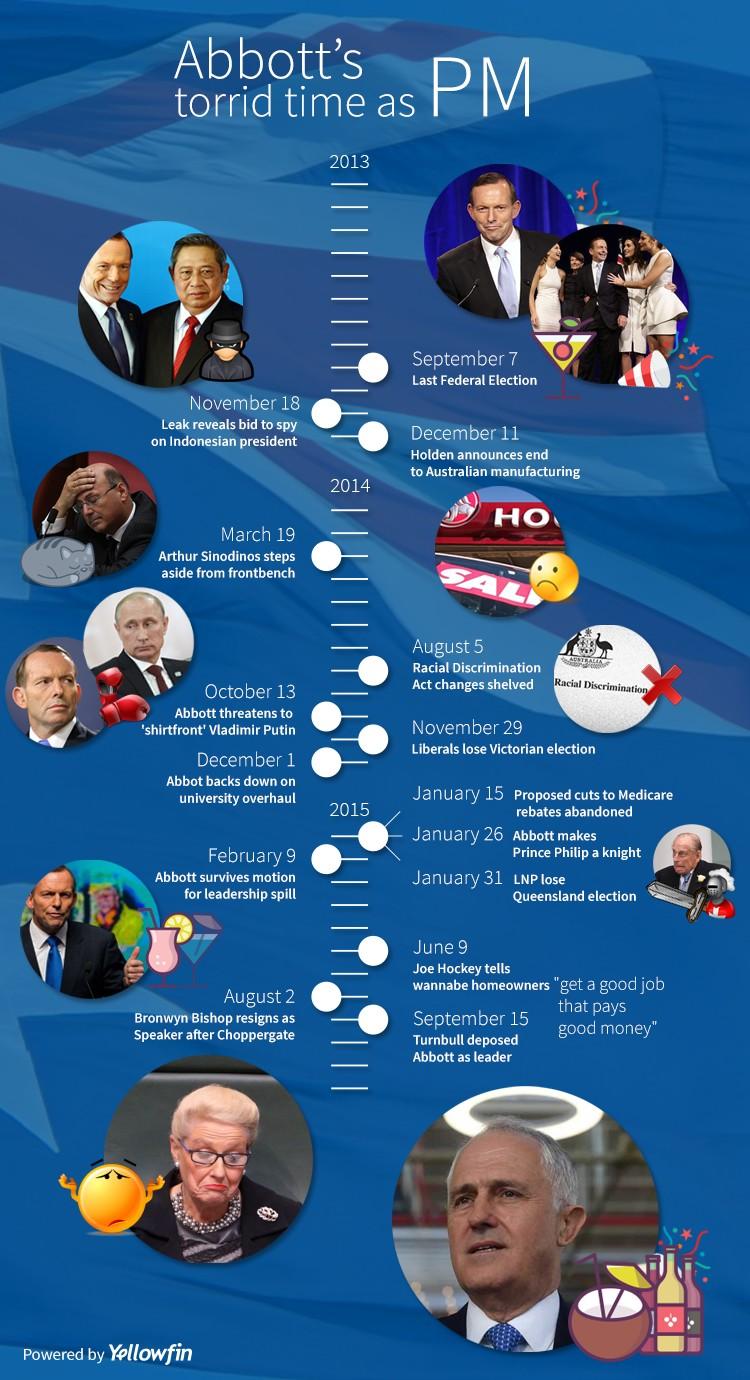
- The Coalition quickly began to fall out of favor with voters towards the end of 2015, with leaks revealing attempts to spy on the Indonesian President (November 18th, 2013), as Holden also announced the end of Australian manufacturing (December 11th, 2013)
-
- Abbott’s awkward antics, combined with Arthur Sinodinos stepping down from the frontbench amidst controversial circumstances (March 19th, 2014) and an unpopular 2014 Federal Budget (May 13th, 2014), saw the Coalition slip to a calamitous position on a two party preferred basis in June 2014 (39.5% vs 60.5%)
-
- Despite improvements in polling from June – October 2014, and strong displays of leadership when Malaysia Airlines flight MH17 was shot down (July 18th, 2014), October 2014 to February 2015 saw another slide as voters responded to several incidents:
-
- Abbott threatened to ’shirtfront’ Vladimir Putin (October 13th, 2014)
-
- Liberals lost Victorian election (November 29th, 2014)
-
- Abbot backed down on university overhaul (December 1st, 2014)
-
- Proposed cuts to Medicare rebates abandoned (January 15th, 2015)
-
- Abbott made Prince Philip a knight (January 26th, 2015)
-
- LNP lost Queensland election (January 31st, 2015)
-
- Abbott survived motion for leadership spill (February 9th, 2015)
-
- Despite improvements in polling from June – October 2014, and strong displays of leadership when Malaysia Airlines flight MH17 was shot down (July 18th, 2014), October 2014 to February 2015 saw another slide as voters responded to several incidents:
-
- Pressure built over politicians' use of tax payer funds, centering around the Bronwyn Bishop Choppergate saga, which culminated in her resignation (August 2nd, 2015)
-
- For almost the entirety of Abbott’s time as PM, from December 2013 to September 2015, Labor led the Coalition government in two party preferred polling
 Which Party do Voters Trust to Handle the Big Issues?
Insights
Which Party do Voters Trust to Handle the Big Issues?
Insights
-
- Voters trust the Coalition more than the Labor Party on 6/15 big election issues
-
- Voters trust the Labor Party more than the Coalition on 9/15 big election issues
-
- Interestingly, a higher proportion of voters didn’t know if they could trust one or both parties on 15/15 issues compared to those who did
-
- Significantly more voters believe that the Coalition is better at managing Australia’s economy
-
- Over 37% of voters believe the Coalition would be most likely to reduce Australia’s deficit if they won the 2016 election
-
- Just 14% of voters believe the Labor party would be most likely to reduce Australia’s deficit if they won the 2016 election
-
- Significantly more voters believe that the Coalition is better at managing Australia’s economy
-
- Interestingly, almost one third of voters did not believe it would make any difference which major party won
-
- As a voting group, Coalition supporters overwhelming backed their party to reduce the budget deficit (79%)
-
- More Labor supporters (39%) believe neither a Coalition or Labor government would impact the ability to reduce the budget deficit, compared to Labor supporters who think Labor would do a better job of reducing the deficit than the Coalition (35%)
-
- More Green supporters (49%), and more supporters who back ‘Other’ parties (45%), believe that neither a Coalition or Labor government would impact the ability to reduce the budget deficit
-
- More Labor supporters (39%) believe neither a Coalition or Labor government would impact the ability to reduce the budget deficit, compared to Labor supporters who think Labor would do a better job of reducing the deficit than the Coalition (35%)
-
- A majority of Australians (59%) believe that the level of immigration into Australia over the last ten years has been too high
-
- More Australians agree (46%) than disagree (40%) with the statement that multiculturalism has failed and caused social division and religious extremism in Australia
-
- A majority of Australians (57%) disagree that Australia should increase its intake of refugees
-
- More Australians would trust the Coalition (41%) than Labor (28%) to have the ‘right’ policies on immigration
-
- Turnbull was a breath of fresh air when he took over as Prime Minister in September 2015, with a Total Approval rating of 47%, and a Total Disapproval rating of just 17%
-
- Turnbull’s Total Approval peaked at 56% in November / December 2015
-
- Turnbull’s honeymoon period was officially over at the end of March 2016 when his Total Approval and Total Disapproval ratings intersected at 39%
-
- In the last three months Turnbull’s Total Approval and Total Disapproval ratings have fluctuated, passing and then repassing each other in quick succession
-
- Turnbull’s honeymoon period was officially over at the end of March 2016 when his Total Approval and Total Disapproval ratings intersected at 39%
-
- The only point at which Shorten’s Total Approval rating has been higher than his Total Disapproval rating was at the beginning of his time as Opposition Leader in November 2013 – May 2014
-
- From the beginning of April to the end of June 2016, confirming popular belief that he has run an unexpectedly strong election campaign, Shorten has driven-up his Total Approval rating from 27% to 37%.
-
- Simultaneously, Shorten has driven down his Total Disapproval rating from 44% to 39%
-
- From the beginning of April to the end of June 2016, confirming popular belief that he has run an unexpectedly strong election campaign, Shorten has driven-up his Total Approval rating from 27% to 37%.
-
- When Turnbull started his stint as Prime Minister in September 2015, more than three times the number of people thought he would make a better Prime Minister than Bill Shorten (53% vs 17%)
-
- By December 2015, only five percent of voters thought Shorten would make a better Prime Minister than Turnbull
-
- Since February 2016, the percentage of people who think Turnbull would be a better Prime Minister than Shorten has steadily decreased, while the percentage of people who think Shorten would make a better Prime Minister than Turnbull has steadily increased
-
- In the week leading up to this Saturday’s election, although Shorten has narrowed the gap, 40% of voters still think Turnbull would be a better Prime Minister than Shorten, with 29% believing Shorten would be a better Prime Minister than Turnbull
-
- Since February 2016, the percentage of people who think Turnbull would be a better Prime Minister than Shorten has steadily decreased, while the percentage of people who think Shorten would make a better Prime Minister than Turnbull has steadily increased
-
- According to polling, people believe that a Coalition victory is the most likely outcome (39%)
-
- Coalition voters are more confident of a Coalition victory than Labor voters are of a Labor victory
-
- 75% of Coalition voters expect to be celebrating on Saturday
-
- Only 58% of Labor voters expect to be celebrating on Saturday
-
- Coalition voters are more confident of a Coalition victory than Labor voters are of a Labor victory
-
- A higher proportion of Labor voters expect Saturday’s election to result in a hung parliament, compared to Coalition voters
-
- 12% of Labor voters expect a hung parliament
-
- 9% of Coalition voters expect a hung parliament
-
- A higher proportion of Labor voters expect Saturday’s election to result in a hung parliament, compared to Coalition voters