

Yellowfin Signals: What is a step change?
Blog Contents
hide
Comprehensive, comparative analysis of data can be a highly time-consuming manual task for your users. But new-wave automation and machine learning (ML) tools makes monitoring, alerting and gleaning new insights a lot faster.
One such example is Yellowfin Signals and the latest addition to its extensive algorithm library, called step change.
Step change is a new algorithm made generally available in Yellowfin 9.2 that helps detect statistical anomalies in your dataset in a single time period. A step change occurs when a time-series of data moves from one stable state to another that is above or below the previous state and exceeds a threshold amount or percentage. These states can be higher than the previous pattern (step up) or lower (step down). There are also transition periods between the stable periods which the step change algorithm accounts for.
Step change signals join other algorithms that detect outliers like breakouts, drops, changes in total and average, new and lost attributes, spikes, trends and volatility changes. With its addition, Yellowfin users have more opportunities for gleaning insights.
Compared to other algorithms that detect drops and spikes, focused more on showing rapid changes in data, step changes focus on identifying, analyzing and alerting users to fundamental and underlying shifts in the metric being measured between stable periods.
Want to learn how step changes can help your analysis efforts? Read on.
How do step changes work?
A typical question we hear from customers is does this kind of advanced analysis make sense in the business world, or is it only useful for analysts who can deep dive statistics?
The answer is both. Below, we’re going to use analyzed data from Apple Inc’s daily stock prices to chart significant changes and illustrate some use cases for step changes.
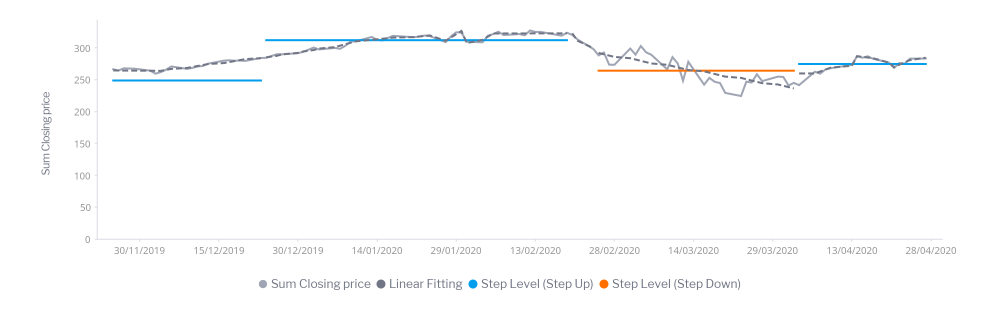
- The Apple Inc. stock price, as shown above, experienced a consistent rise in value, with consecutive step-ups (the blue lines) from late December 2019 to February 2020, an increase in performance - with a bit of research, it likely correlates with reduced worry about China’s trade-war and its estimated impact on iPhone sales earlier in the year.
- The step change signal indicates a step down (indicated by the orange lines) in performance from early February 2020 - which coincides with the global impact of COVID-19 - until the start of April 2020, where Apple rallied and stabilized its business.
- The black graph line beneath each step level line is called a stable stage, which indicates a steady state of performance and when the data fluctuates around a specific step state. Where this line connects with the next step change signal is called a transition stage, which is a ramp up or down from one steady state to another.
- As we see, from April 13, 2020, a new stable stage (and step-up) has been reached, giving us a good visualized overview of exactly when a new state begins and ends.
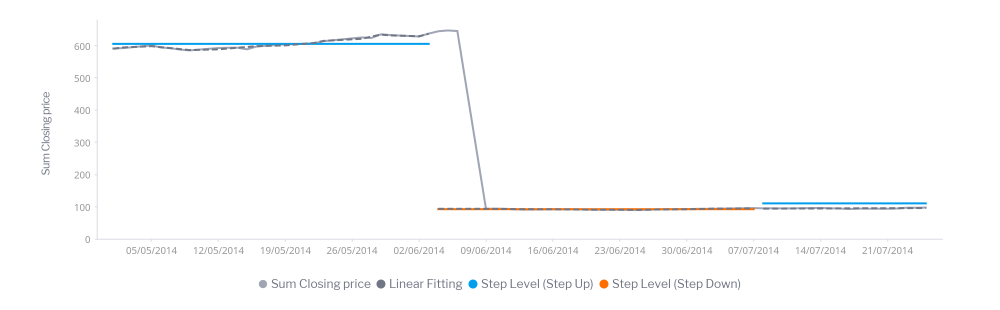
- In this example that’s a bit earlier, we can better see a profound moment in Apple’s FY2014/2015 when their share prices experienced a sharp step-down in value, attributed to a time period when each Apple share was split into 7 to reduce the price to make the stock accessible to smaller investments - and only a minor step up in state just over a month later.
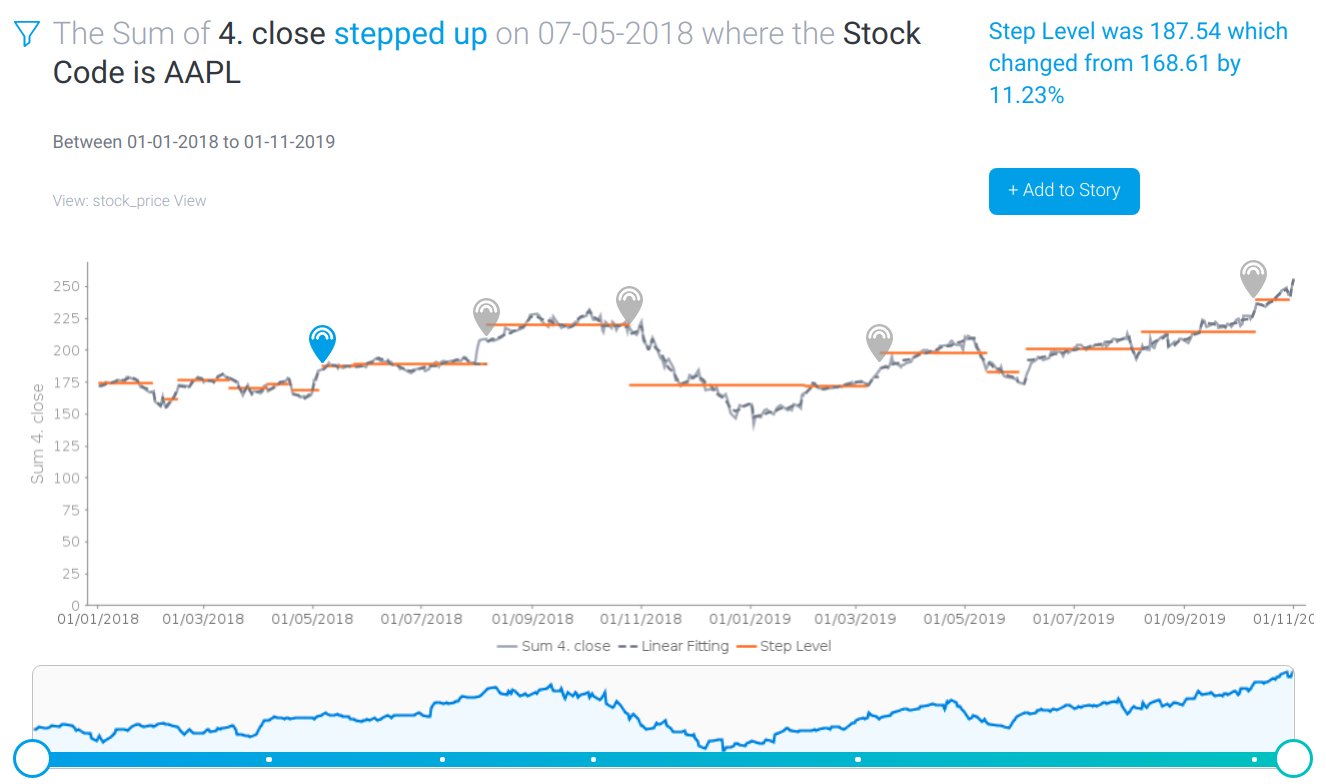
- Analyzing Apple’s daily stock close prices from January 2018 to November 2019, we can see 5 step change signals detected based on a 10% change threshold we set in advanced parameters. This has since automatically alerted users to the findings.
- In the first signal as shown above, the step change detected a step up in early May 2018 by 11.23%. This helped our testers explore and discover the step change alert coincides with an important internal event (Apple reporting strong Q2 results) and an external event - a media release (prominent investors publicly giving avote of confidence).
- This same algorithm isn’t limited to stock prices - it can now be used to chart your own unique datasets and performance, and better detect, identify and alert users of these fundamental shifts in performance state - and help alert and guide your users toward the underlying causes within.
Where can I use step change signals?
Step change signals are a part of the Yellowfin Signals algorithm library. They can be toggled on for use as a sub-option in the ‘Outlier’ category of signal jobs when setting up alerts. Default and advanced parameters for this signal are available to configure the algorithm to the user’s needs.
For those unfamiliar, Yellowfin Signals is the automated business monitoring product of the Yellowfin analytics suite that uses automation and machine learning to continuously and automatically monitor, analyze and alert users of changes in their dataset, in real-time. Signals personalizes results based on user preferences and usage to deliver the most relevant insights. These can be delivered both inside and outside Yellowfin.
- Within Yellowfin, Signals can arrive to your dashboards, mobile application and timeline.
- For those embedding Yellowfin content, Signals can be delivered to your host app too.
Step changes, like any other signal in Yellowfin Signals, can be integrated directly into your users’ dashboards. Simply add the Signals List widget to your canvas dashboard, and from there you can select step changes in your Signals list and apply additional filtering to match the dashboard’s intention. You now have fine-grained control of which view, Signal job, and type of signals are displayed (recently viewed, user followed or all Signals) as well as when they were generated.
Above is an example of Signals being added to a Yellowfin dashboard to analyze the key drivers behind life expectancy, which you can read about in more detail in our separate blog post here.
There are many different types of changes that can occur in our data, and these changes take many different forms in our analysis. Step changes act as another helpful way for your users to find more of these profound patterns and alert them of potential insights.
Of course, with more changes able to be found and more notifications for our users to act, there is the possibility your users can feel overwhelmed with new information.
Step changes, like all other Yellowfin Signals algorithms, counteract this problem by using a ranking and personalization algorithm so that only the most relevant or critical changes are sent as an alert to the user. If they want to view all the detected signals manually, they can also do so through the overarching Signals list.
Why use Yellowfin step change signals?
Yellowfin Signals are all about helping your users automate the process of discovering relevant changes in your data so they can make decisions and act faster. But finding insights solely through manual comparative analysis is a time-consuming process.
As Gartner's Rita Sallam mentions in Augmented Analytics: The Future of Data and Analytics, "It's not possible for users to explore every possible combination and pattern using current approaches, let alone determine whether their findings are the most relevant, significant and actionable." This is where new algorithms like step changes and Yellowfin Signals come in to fill the gap.
What step changes and other in-built machine learning algorithms of Yellowfin Signals do is help make the overall data discovery process more efficient and less time-consuming, by combining - not replacing - powerful automated detection and alerting with your users’ own deep analysis.
Learn more about Yellowfin 9.2
Keep up-to-date on the latest additions to Yellowfin Signals and leverage automation for your monitoring and alerting. Bookmark our 'What's New in Yellowfin' page below.