

What is the Impact of Using a Business Analytics Dashboard?
Key takeaways
- It provides a centralized view of your most critical KPIs and metrics.
- They promote data-driven decision-making across departments.
- Yellowfin dashboard analytics enable real-time insights and collaboration with built-in tools.
- Customizable interfaces ensure stakeholders access data relevant to their needs.
- Integration with Signals and automated alerts makes Yellowfin dashboards proactive, not reactive.
In this blog, we answer the age old question question of what a dashboard is, and how a business intelligence dashboards can greatly help you improve your overall performance. We also discuss the impacts of using dashboards, and how you can get the most out of it.
What is a business analytics dashboard?
A business analytics dashboard brings data from multiple sources into a single visual interface, displaying key metrics, trends, and performance indicators in one place. It enables leaders and teams to monitor performance and make informed, data-driven decisions. Modern analytics dashboards like Yellowfin go beyond visualization by incorporating automation, intelligent data discovery, and features that enhance decision-making.
What is the difference between BI dashboards and business analytics dashboards?
Listing below is the difference between a BI dashboard analytics and a Business analytics dashboard:
| BI Dashboards | Business Analytics Dashboard |
|---|---|
| Focus on “What happened?” | Focus on “Why did it happen?” and “What will happen next?” |
| Monitoring current metrics and KPIs should be the priority for data visualization in business. | Focus on identifying temporal trends and patterns, as well as insights that evolve over time. |
| Operating performance serves as the main target for this tool. | Primarily used to produce strategic analysis and facilitate decision-making processes. |
| Contains static information that is periodically updated with minimal interaction. | Enables interactive investigations using filters across multiple data levels. |
What is the Impact of Using BI Dashboards?
BI dashboards, combined with data visualization, help managers, end-users and decision-makers take data-led action and identify opportunities for growth. By understanding how customers interact with your business, you can improve customer service and drive revenue growth a lot better than just relying on intuition or gut feeling.
The impact of business intelligence is seen in how quickly organizations can adapt to changes, uncover trends, and optimize strategies through real-time insights from BI dashboards.
Here's some of the major ways how BI dashboards can impact your business and help:
1. Communicating Business Critical Information At-a-Glance
BI dashboards can help you quickly and easily access key data to make informed decisions. By seeing trends and patterns, you can make better decisions about where to allocate resources and what changes to make.
You can monitor business performance in real time and make adjustments as needed. This helps you stay ahead of the competition and stay in control of your business.
2. Timely, Easy Access to Information for Everyone
Not only data analysts and developers can benefit from dashboards. Anyone who needs to access critical information quickly and easily can benefit.
This includes marketing managers, finance personnel, and even your customers. By creating centralized dashboards, you can make it easier for everyone to access the information they need, providing actionable insights in a timely manner.
3. Data-Driven Decision Making for All, Fostering a Data Culture
A data-driven culture helps you identify opportunities and avoid potential pitfalls. Data points can help you make informed decisions about your business. By understanding what's happening in your data, you can make better strategic decisions and optimize your operations.
BI reports can help you identify where you need to focus your efforts and identify potential risks. This helps you stay ahead of the competition and optimize your business for growth.
4. Less Guesswork and Intuition, More Usage of Proven Forecasting Methods
By using predictive modeling and other forecasting methods, you can ensure that your business is prepared for what's coming. BI dashboards saves you time and money, as you're not forced to react to unforeseen circumstances when you have a at-a-glance summary of your most important reports and business metrics available in analytical dashboards.
A self service BI platform can help you automate your forecasting processes. This means you can focus on more important tasks, such as running your business. You can get insights into your data in a matter of minutes, rather than hours or days.
You can gain insights into your data in minutes, rather than hours or days, enabling faster, more data driven business decision making.
5. Real Time Analytics of Customer and End-User Behavior to Adjust On-the-Fly
An analytics platform can help you understand customer and end-user behavior in real time. This allows you to make adjustments to your marketing and sales strategies as needed. You can also track how your customers are using your products and services with BI dashboards. This helps you to improve customer satisfaction and increase sales. Through dashboard analytics, it speeds up the process of creating better outcomes by analyzing the insights of the customer.
6. Enhanced Visibility of Data Across the Entire Business
Data visualizations make it easy to see patterns and trends. Combined with properly designed dashboards, it can help you make better decisions and improve your operations significantly.
A BI platform can help you create dashboards that show data in a variety of ways. This way, you can see all the data that's important to your business. You can also get alerts in your dashboard when there's a change in your data. Data visualization in business helps businesses in analyzing insights and taking quick action, making dashboards an essential tool for data-driven decision-making.
7. Better resource allocation
Business intelligence dashboards help organizations identify underutilized assets and allocate resources more effectively. Real-time business insight enables managers to base decisions on current data, ensuring resources are directed toward high-impact areas. By forecasting future needs, dashboards support both short-term adjustments and long-term operational planning.
8. Customizability and flexibility of BI dashboards
Customizable BI dashboards allow organizations to track metrics that matter most to their goals. By highlighting bottlenecks, duplicate efforts, and underperforming assets, dashboards help optimize workforce and tool utilization. Flexible views of workloads, timelines, and ROI enable teams to adapt quickly and reduce unnecessary costs through continuous, data-driven improvements.
Business analytics dashboards improve collaboration by enabling real-time data sharing, comments, and annotations. Teams across departments work from a single source of truth, reducing communication gaps and alignment issues. This shared visibility accelerates feedback, decision-making, and follow-up actions.
10. Cost saving through optimized operations
Dashboards help organizations uncover inefficiencies such as wasteful spending, redundant processes, and low-performing initiatives. Real-time visibility allows issues to be identified early, preventing cost overruns. Combined with predictive analytics tools, dashboards support ongoing optimization and sustainable cost control.
What are the benefits of a business analytics dashboard?
Here are some of the key benefits mentioned below:
- Faster decision-making: Identifying trends together with recognizing performance problems occurs with instant speed.
- Improved accountability: Transparency in metrics allows team members to monitor progress through progress tracking.
- Better alignment: Every employee should access the same data sources to work.
- Real-time insights: Live data updates enable organizations to recognize changing conditions ahead of time.
By understanding what is a dashboard in data analytics and implementing the right tools, users can maximize their efficiency in operation streamlining and discovery of departmental insights.
Related: 4 Key Features of a Modern BI Dashboard
Real-world use cases of business analytics dashboards
Some of the real-world use cases that enable organizations to make data driven business decision. Here are some of the use cases listed:
Sales and marketing
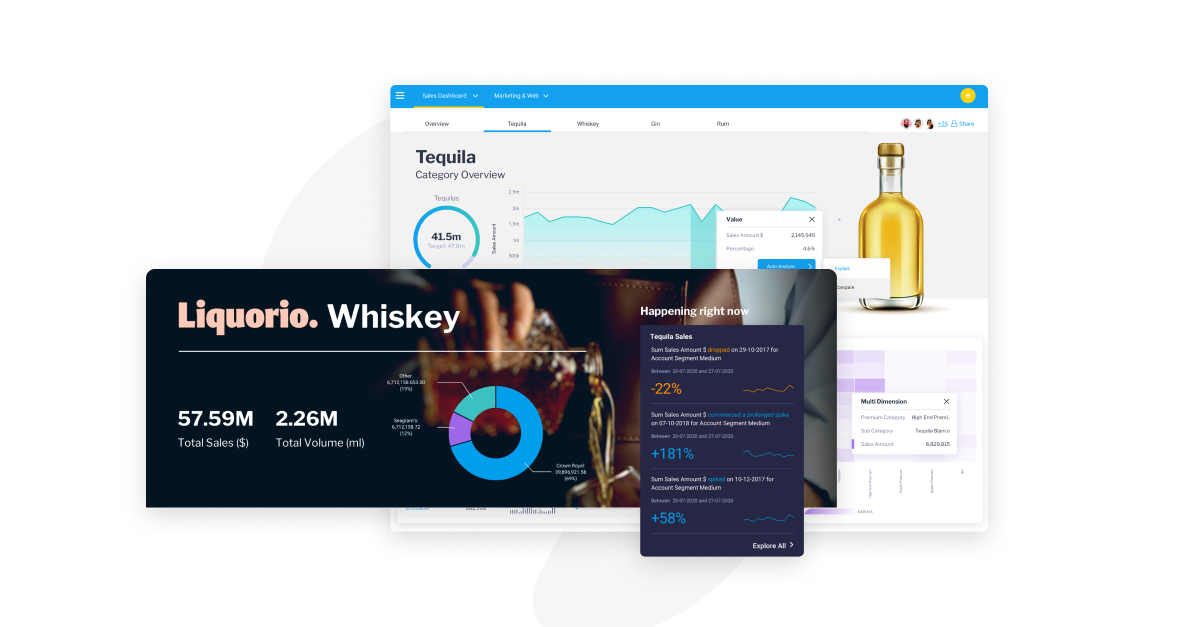
Real-time monitoring of campaign success and lead transformations, along with sales pipeline development and customer behavior, happens through Yellowfin dashboards. The platform helps monitor ROI while depicting customer paths and promoting sales-marketing coordination.
Finance and operations
Users can achieve complete transparency regarding cash flow tracking, along with operational budgeting and supplier data monitoring, as well as cost management. Yellowfin delivers KPI tracking for revenues, margins, and expenses to finance teams, yet provides operational process optimization for operations teams.
HR and workforce analytics
HR teams utilize tools to monitor hiring pipelines in addition to employee engagement levels, training success, and diverse employee tracking metrics. Through flexible dashboard analytics within Yellowfin, leadership gains the ability to synchronize workforce strategy with business objectives.
IT and technical teams
The IT department should track system operational integrity, service reliability, ticket issue resolution statistics, and end-user computer usage patterns. Located within systems, Yellowfin assists technical staff in creating automated reports and efficiently integrates insights into workplace applications and platforms.
What are some of the business analytics dashboard examples?
Some of the business analytics dashboard examples are mentioned below:
- Executive dashboard analytics: Aggregate key business KPIs for top-level overviews.
- Customer support dashboards: The monitor displays ticket volumes alongside resolution rates, together with CSAT scores to track customer support performance.
- Marketing performance dashboards: Significant Campaign achievements across Multiple Channels Can Be Monitored Effectively through these Dashboards.
- Financial dashboards: Visualize P&L statements, cash flow, and expense trends. Users can access live demo examples through the dashboard gallery to review before using them for their particular business requirements, including predictive analytics tool integration for future trend analytics.
What is the importance of custom dashboards in business analytics?
The dashboard system provides department specific performance indicators and metrics based on their roles. Users gain access to Yellowfin dashboards built to meet the requirements of both executive positions and data analyst reporting systems. By deploying custom dashboards, companies can reduce distracting information while gaining better acceptance from users throughout their organization, thus highlighting the importance of BI in improving decision making efficiency.
How to create an analytical dashboard
The user can create an analytics dashboard by following these steps:
-
- Identify your business questions: Mark down your business inquiries to determine which metrics require tracking.
- Connect your data sources:
Your data sources should be connected since Yellowfin works with numerous database systems and cloud solutions. - Choose your KPIs and metrics: Select the suitable KPIs and metrics according to what matters most, keeping in mind the importance of BI for focusing on what truly drives performance.
- Design the layout:You should utilize Yellowfin’s drag-and-drop builder to design the layout.
- Add interactivity: The application should include Filters, drill-down capabilities, and conditional formatting.
- Test and iterate:
Review the dashboard with end-users before performing additional adjustments. - Launch and share:The software enables dashboard release and distribution across multiple teams who use different devices.
What are the common challenges of business analytics dashboards?
Here are some of the common challenges of business analytics dashboards:
- Data silos: When data resides in disconnected sources the organization faces limited access to complete visibility across all information.
- User adoption: Technical users might avoid adopting complex information systems that they are not familiar with.
- Lack of actionability: Static reports fail to generate actionable decisions because they do not facilitate real decision-making.
While these challenges are common, overcoming them is key to realizing the full benefits of BI, from faster insights to improved collaboration. A visual interface builder combined with workflow automation, data storytelling tools, and signal automation functions establishes Yellowfin as an effective solution to address these issues.
Next Steps: Finding the Right Dashboard Solution
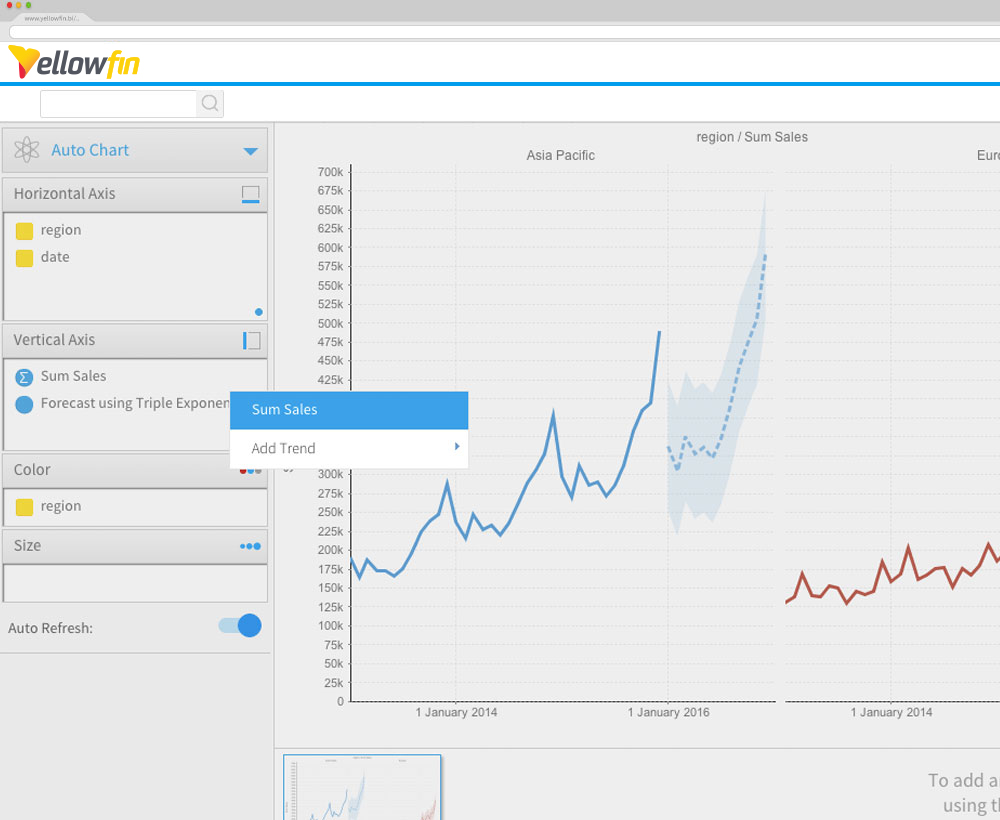
Yellowfin is packed with powerful features that make it easy to create and use business analytics dashboards, with powerful dashboard design tools that make it easy to compile your most important KPIs and metrics in a single interactive space, and create graphs and charts that illustrate your data in a clear and concise way.
Yellowfin's data discovery tools help your users find insights they may have missed before, an interactive dashboard gallery that lets you interact with best practice BI dashboard examples, and several out-of-the-box dashboard samples that you can further customize to your unique use cases and audience requirements.
It's a definitive solution for the ever-present question - what is a dashboard? But don't take our word for it - see it for yourself, in action.
HyperText Markup Language (HTML) is the standard markup language for creating web pages and web applications.