

How to Measure Embedded Analytics ROI for Busy End Users
Most analytics programs fail the ROI test for one simple reason: they measure dashboard output, not workflow impact. A team can ship reports, charts, and alerts, yet still miss the real question: does the analytics change what busy people do next?
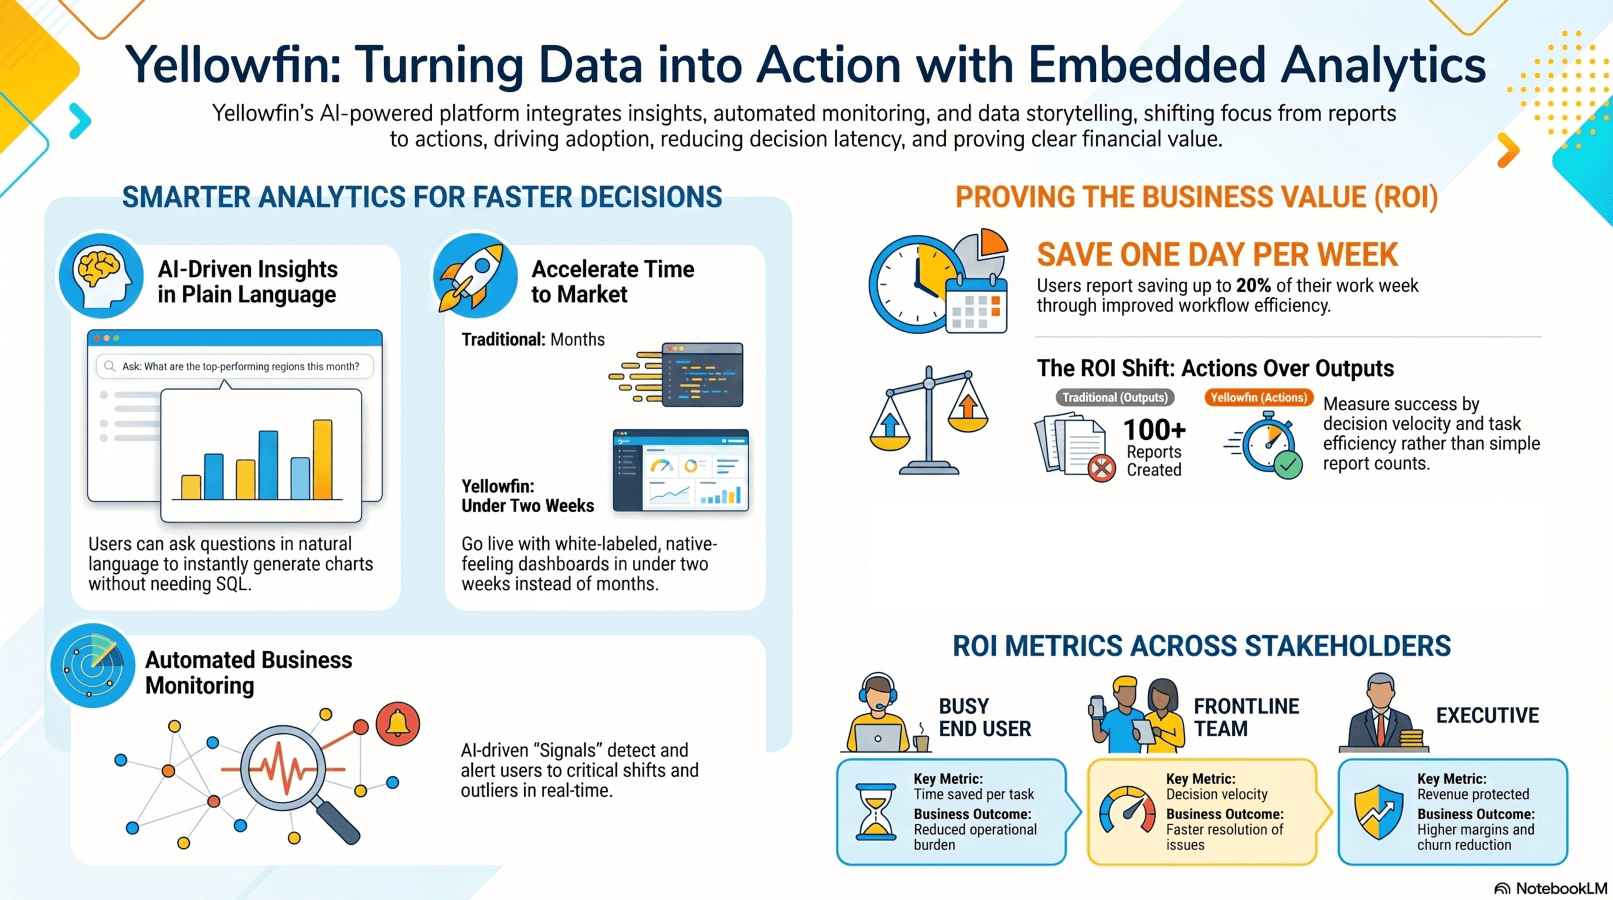
That is the core issue for embedded analytics ROI. How do we measure whether embedded analytics actually delivers business value for busy end users, frontline teams, and executives?
This article keeps the focus on practical measurement. It covers embedded analytics ROI for non-technical users, then ties it to business outcomes, not just usage counts. For Yellowfin users, that matters because embedded analytics should feel native, drive adoption, and speed up decisions. The right lens is workflow efficiency, adoption, retention, revenue protection, and decision velocity.
If you want to go deeper while you read, take a look at Yellowfin's embedded analytics and the latest Yellowfin 9.17 AI-powered features.
What embedded analytics ROI actually means for busy end users
Embedded analytics puts charts, alerts, and data stories inside the app or workflow people already use. Traditional BI sits apart in a separate portal. That difference changes the ROI model.
When analytics live in the workflow, users switch screens less. They get answers faster. Operational users adopt the tool more often because the data shows up where the work happens. The result is better decisions in the moment, not later in a review meeting.
That is where Yellowfin fits well. Its embedded experience is built to feel native, with white-labeled delivery that blends into the host product. For SaaS teams, that matters because the analytics should look and feel like part of the product, not a bolt-on report center.
The ROI shift from "reports created" to "actions taken"
Traditional BI ROI often leans on report counts, query volume, and analyst productivity. Those measures are fine, but they miss the point for embedded analytics.
Embedded analytics ROI should track actions. Did a rep resolve a case faster? Did a manager approve an exception sooner? Did a planner catch a risk before it became a loss?
Use these measures instead:
- Time saved per task
- Faster approvals and escalations
- Fewer errors
- Higher retention or product stickiness
- Revenue protection through earlier intervention
This matches a basic idea in McKinsey's analytics and AI research: value comes from operational adoption, not just technical deployment.
The core ROI framework: measure workflow efficiency, adoption, retention, and decision velocity
Busy users do not care how many dashboards exist. They care about how long work takes.
Start by measuring the time spent on common tasks before and after embedded analytics goes live:
- Finding data
- Reconciling spreadsheets
- Building manual reports
- Chasing status updates
Then track simple metrics:
- Minutes saved per task
- Tasks completed per hour or day
- Reduction in manual steps
- Fewer support tickets to data teams
This is the kind of value frontline and operational workers feel right away. They want answers inside the flow of work, not in another tool that slows them down.
Business outcome metrics executives care about
Executives want the same story, just on a wider scale. Map each use case to a business KPI.
Examples include:
- Retention and churn reduction
- SLA compliance
- Sales conversion uplift
- Inventory or labor optimization
- Customer response time reduction
The value shows up as fewer escalations, fewer losses, and faster decisions. Yellowfin Stories and collaboration features help here because they create shared context. Teams see the same chart, the same narrative, and the same next step.
| Measurement layer | Example metric | Why it matters | Typical data source |
| Workflow efficiency | Time saved per task | Reduces operational burden | Workflow logs, user surveys |
| Adoption | Weekly active users, feature usage | Shows actual usage depth | Product analytics |
| Retention | Renewal rate, churn reduction | Proves customer value | CRM, subscription data |
| Decision velocity | Time to decision | Measures speed of action | Process timestamps |
| Business impact | Revenue protected, cost avoided | Executive ROI proof | Finance, operations |
How to prove embedded analytics ROI with practical formulas and benchmarks
Keep the math plain.
ROI (%) = [(Total benefits - Total costs) / Total costs] x 100
Break the benefits into clear buckets:
- Labor hours saved
- Reduced analyst support costs
- Higher retention or expansion revenue
- Avoided losses from faster alerts
A simple working formula looks like this:
(Hours saved x fully loaded hourly cost) + revenue uplift + loss avoidance - implementation/subscription cost
That formula is easy to explain in a review meeting. It also keeps the discussion on business value, not feature lists.
Benchmarks and evidence to anchor the business case
Use benchmarks carefully. They help frame the case, but they do not replace your own baseline.
Yellowfin reports that customers save up to a day per week in some use cases. That number should be checked against each deployment. Still, it shows where value can appear when users stop bouncing between tools and get faster access to answers.
This matters most where decisions happen often and under time pressure. That lines up with Nielsen Norman Group guidance on usability and efficiency, which links better usability to less task time and less effort.
Yellowfin's AI NLQ, Assisted Insights, and Signals also cut the time from question to answer. That makes the ROI story easier to prove.
Measuring ROI by audience: busy end users, SaaS customers, frontline teams, and executives
For frontline teams, the best metrics are the ones tied to daily work.
Focus on:
- Time to retrieve info
- Reduced reliance on analysts
- Faster exception handling
- Better compliance with process steps
Good KPI examples include:
- Cases handled per rep
- On-time resolutions
- Schedule adherence
- Exception closure time
These metrics show whether embedded analytics for operational teams is actually helping people act faster and with less friction.
SaaS customers and executive buyers
For SaaS customers, embedded analytics ROI often shows up in product behavior.
Look for:
- More logins and deeper feature use
- Higher product stickiness
- Lower churn
- Expansion revenue or premium analytics upsell
For executives, the questions are direct:
- Does this reduce decision latency?
- Does it improve customer experience or margin?
- Does it create differentiation or protect revenue?
Yellowfin embedded analytics can support that case because it gives product teams a way to add analytics that feel part of the application, while also improving adoption and retention.
| Persona | What they care about | Best ROI metric | Example outcome |
| Busy end user | Speed, simplicity | Time saved per task | Less spreadsheet work |
| Frontline worker | Real-time action | Decision velocity | Faster issue resolution |
| SaaS customer | Product value | Retention / expansion | Higher renewal rates |
| Executive | Business impact | Revenue / cost benefit | Better margin or churn reduction |
How implementation choices affect ROI: build vs buy, features, and UI
Build vs buy embedded analytics is one of the biggest ROI forks. An in-house build often starts with excitement, then grows into a long maintenance bill. Engineering time rises. Security reviews pile up. Scalability becomes a problem. Feature parity with modern analytics keeps pulling the team back into the codebase.
Buying a mature platform changes that math. A platform like Yellowfin shortens time to value. Yellowfin also positions embedded analytics as something that can go live in days, not months. That matters when the business wants proof, not a long roadmap.
UI and feature quality drive adoption, which drives ROI
Adoption sits in the middle of the ROI chain. No adoption, no value.
Busy users respond to tools that are quick and clear. The features that matter most are:
- White-labeling
- Natural language query
- AI-explained insights
- Real-time alerts
- Stories and collaboration
Modernization benefits and embedded BI platform comparisons
Older BI stacks make ROI harder to prove. Usage is split across tools. Adoption stays low. Insights do not sit inside workflows. And reporting is often too slow for operational decisions.
Modern embedded analytics gives you cleaner measurement. You can track usage, trigger alerts, and deliver insights in context. That makes it easier to connect analytics activity to business results.
What to compare when evaluating embedded BI platforms
When comparing platforms, focus on the parts that affect both adoption and measurement:
- Time to embed
- White-label flexibility
- Ease of use for non-technical users
- AI support
- Governance and security
- Collaboration and storytelling
- Cost of ownership
If you are comparing platforms or replacing an older stack, the Yellowfin Migration Guide for Power BI alternatives is a useful starting point.
A practical 30-day ROI measurement plan for Yellowfin users
Week 1-2: establish baseline metrics
Start with current-state numbers:
- Time spent on reporting tasks
- Number of manual steps
- Decision turnaround time
- Current dashboard adoption
Pick 2 or 3 high-value workflows. Keep the scope tight. That gives you cleaner numbers later.
Week 3-4: measure change and report value
After launch, track:
- Weekly active users
- Feature adoption
- Time to insight
- Escalation reduction
Then write a short executive summary:
- What improved
- What it is worth in dollars
- What to adjust next
Yellowfin helps here with fast deployment, embedded dashboards, Stories, and AI-driven insights.
Conclusion: embedded analytics ROI is proven in faster decisions, better adoption, and measurable business outcomes
Embedded analytics ROI is not a license metric or a dashboard count. It is a business performance metric. The right measures are workflow efficiency, adoption, retention, decision velocity, and revenue protection.
For busy end users, the proof is simple. Less wasted time. Faster action. Better decisions.
Explore Yellowfin's embedded analytics solutions, try Ask Yellowfin and Code Assistant, and request a demo to test ROI in your own environment.