

How to create 3D Body Maps in Yellowfin BI
Blog Contents
hide
From linking analytic content with JavaScript APIs to extending visualization capabilities with JavaScript charts, Yellowfin opens up a range of toolsets for your data projects.
One particular feature that our customers request is 3D body mapping, and whether exporting 3D models and utilizing its visualization and filtering can be easily applied.
This technical walkthrough shows you how to leverage Yellowfin to integrate 3D models within Yellowfin and then use them to create a fully interactive display in your dashboard.
3D Body Maps in Yellowfin: The Pre-requisites
Before any body mapping with Yellowfin can begin, there are four core resources you'll need:
- A 3D modeling program such as Blender
- JavaScript Charts and Code Mode enabled in Yellowfin
- Three.js libraries placed into your Yellowfin installation's ROOT folder (located at <your_yellowfin>/appserver/webapps/ROOT/)
- Yellowfin version 9.4.2
To see it all in action, we’ve provided all of the necessary files which you can download by clicking here. In addition, we've included a full video walkthrough - you can watch below.
Step 1: 3D Model Setup
The first order of business is to create a 3D model in your favorite tool, save it and export that model into the standard glTF file format. For the purposes of this technical walkthrough, we used Blender as it is a free 3D modeling tool. However, most other tools also allow you to create and export models in this format.
If you're using Blender, you can follow our walkthrough by using the attached file:
basic_person.blend
If you opt to use another tool, you can import the following file:
basic_person.glb
Once you've imported the basic_person file into Blender, you should see the following on your screen:
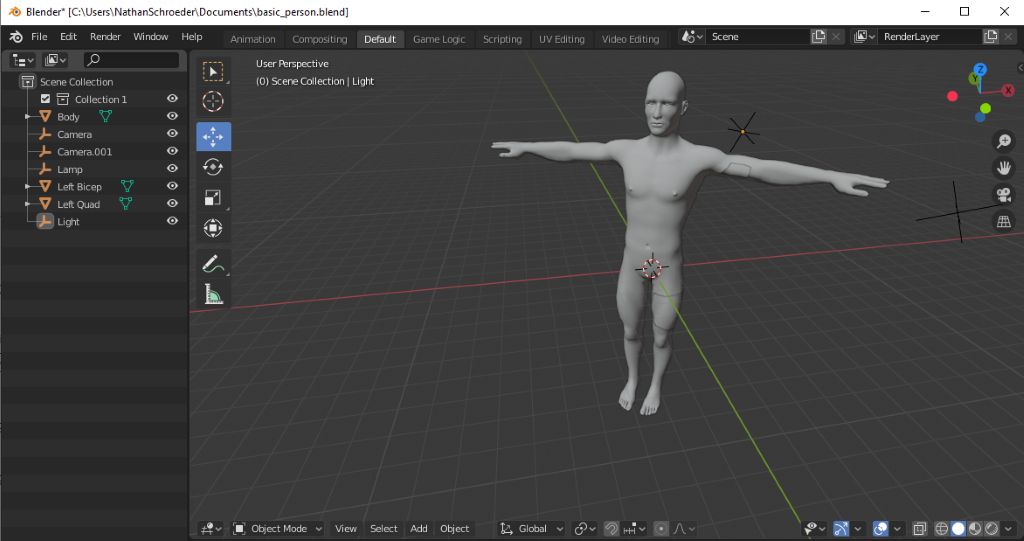
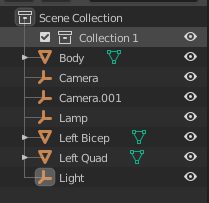
Note we have separated individual objects for each part of the person’s body, and given distinct names to each. This will be important when we consume the model in Three.js.
In practice, this would be a more linked and complex structure, but we are keeping it simple for demonstration purposes so you can get up and running quicker.
tytyfftuyftuyfuy
If you wish to edit this model further before proceeding, you can. As these tools are quite complex and have a learning curve, we recommended that you familarize yourself with them before following along. There are many videos and guides online to get started.
Once you are done editing, we can proceed to export this again into glTF format, as shown in the screenshot below.
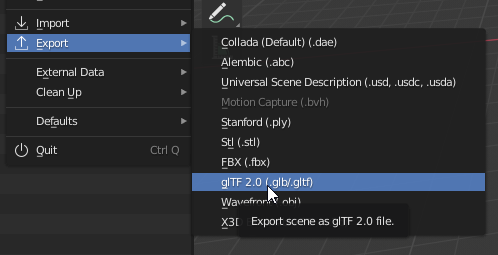
You can then place the exported 3D model into the ROOT folder of Yellowfin, which is located at <your_yellowfin>/appserver/webapps/ROOT/.
Step 2: Create a Yellowfin Report
Now that the 3D model is exported into Yellowfin, we can proceed to create a fresh report in Yellowfin in preparation to link with the prepared 3D model.
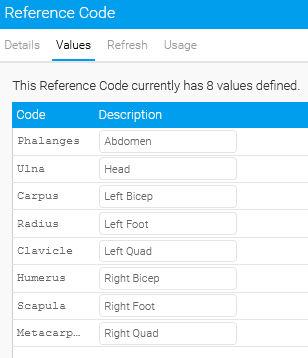
The pre-installed Skiteam data model only offers bone injuries for athletes and since we are tracking muscles instead of bones, we have used a reference code to re-label the “broken bones” field, matching to body areas in the 3D model.
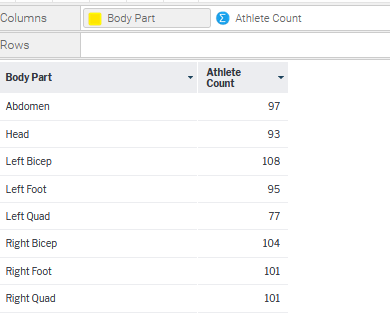
We can then add a metric, like Athlete Count, as shown in these example screenshots:
Placeholder
Placeholder
Step 3: Prepare your JavaScript Chart
To render the 3D model we have created, we will use a library called Three.js. We have attached the JavaScript we used for this walkthrough, but to highlight a few key points:
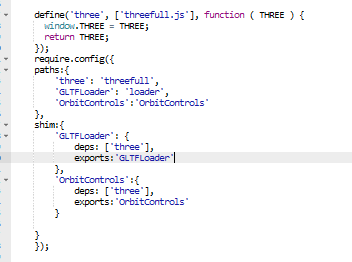
You will first need to place the following libraries (loader.js, OrbitControls.js and threefull.js) in your Yellowfin ROOT folder for this walkthrough.
Within the 3D Body Map report, we will select a JavaScript chart and proceed to reference the libraries:
Placeholder
The first code we will add is to create a canvas div for our scene to be rendered in. You could also just use the chart draw div, as shown in the screenshot below.
Placeholder
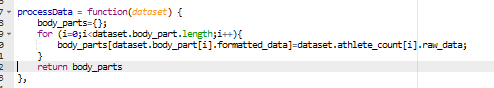
Next, we need to massage the data a little to get it ready. In this case, we create a simple object (body_parts) containing the parts and their counts
Placeholder
{
Abdomen: 97,
Head: 93,
"Left Bicep": 108,
"Left Foot": 95,
"Left Quad": 77,
"Right Bicep": 104,
"Right Foot": 101,
"Right Quad": 101
}
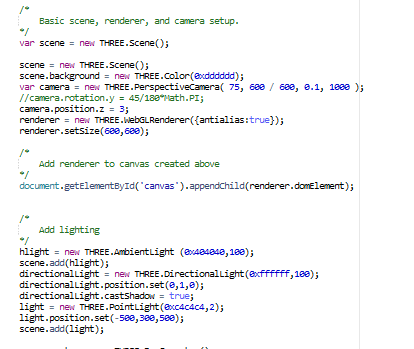
Once Three.js is loaded, we create a scene, define basic parameters, and begin to add a camera and lighting to the scene:
Placeholder
We can then load the 3D model itself into the scene:
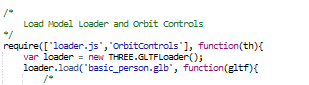
Placeholder
Once loaded, we will iterate through all of the elements in the model (same as the “Scene Collection” list we noted in Blender), searching for body parts, and adjusting the amount of red in the material color based on the count of athletes:
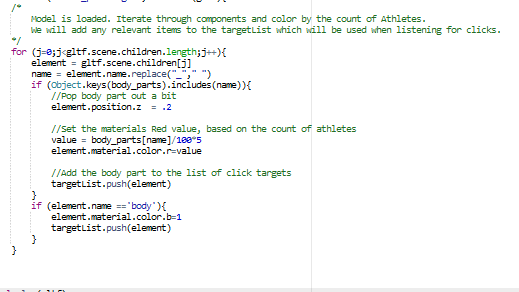
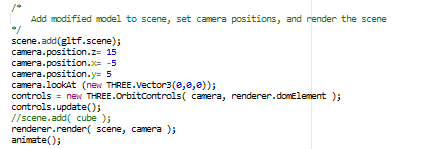
From here, add it to the scene and render.
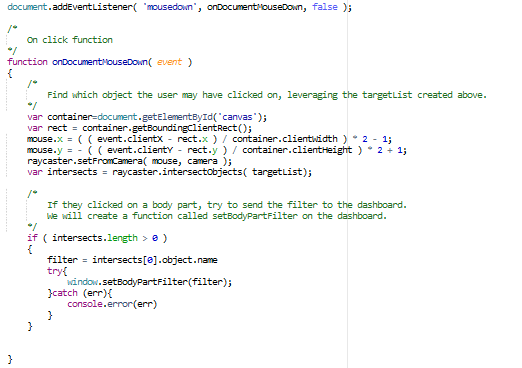
The only thing left to do here, is to handle any possible user clicks. We will do that by comparing the user’s click to our list of body parts.
If the user does click on a body part, we will call a function window.setBodyPartFilter, and pass the object they clicked on. This function does not exist yet in the JavaScript chart, but we will create it in the Yellowfin dashboard’s Code Mode.
Placeholder
Note that we have removed a mapping of the “body part” back to the original “bone group”. If you are using the supplied YFX files, this will look slightly different from what’s shown above.
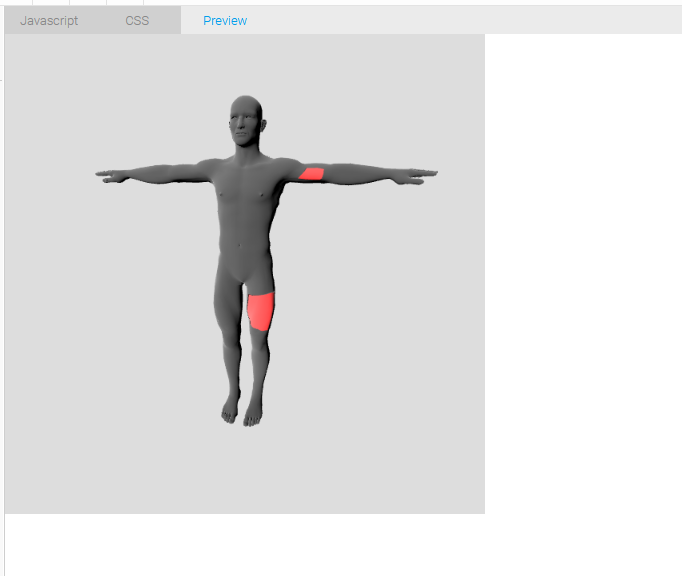
Now, proceed to preview the 3D model. It should look something like this:
Placeholder
Step 4: Link the 3D Model with the rest of your dashboard
It’s time to get our prepared 3D model into our Yellowfin dashboard.
Add the report we just created to the dashboard, along with another report (Player Injuries) that accepts the “Body Part” field as a filter.

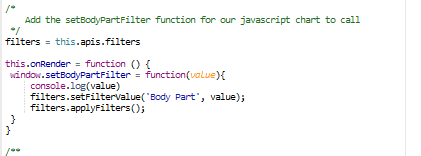
Switch into the dashboard’s Code Mode, and create the setBodyPartFilter function that we referenced in the JavaScript chart. This not only accepts the body part value from our 3D model report but also applies that as a filter to the dashboard by leveraging Yellowfin’s filter API.
Placeholder
Why is this useful? Well, if clicking on a 3D body part sets the dashboard filter then other charts and reports (ie, the Player Injuries report) that are linked to the same dashboard filter will also refresh accordingly!
Step 5: Time to publish and test the body map
Following all proceeding steps correctly, you should now be able to click on each individual body part — either from the body parts filter panel or on the actual 3D model — to filter down the list of athletes.
You can also adjust the demographic filter to see the body parts change colors, as the count of athletes is limited by demographic.
Do more with your BI dashboards
Integrating fully 3D body maps into your dashboards is just one of many examples of Yellowfin's data visualization extensibility - find out what else you can do and the benefits you can unlock today with our latest resources.