
Yellowfin 7.4 Little Things: Presenting data according to discrete time junctures
These features are designed to make the user’s experience richer and more versatile and to allow them to present their data in the best way possible. This blog series will cover these smaller, yet valuable features in detail.
One of the new advancements is the discrete time series. You are probably already using the time series functionality to view trends and patterns in your data over a specific period of time. This is important in order to determine your next business moves. Previously, Yellowfin only allowed you to display your data in a continuous time flow, or as time progresses. But with the introduction of a discrete time series feature, you can now view data according to specific time junctures.
As a content creator, this feature is ideal to control the data that you present to the business. If you need to show that your average sales progressed over time, the continuous time series option still allows you to do just that. But now you have more flexibility in the way you present content; now you can simply reveal the required data according to specific time blocks. Whereas the continuous time option will generate your sales data over a five-month period, going from the oldest month to the newest, changing it to discrete time will display the total sales as they occur during each one of those five months, regardless of the time progression.
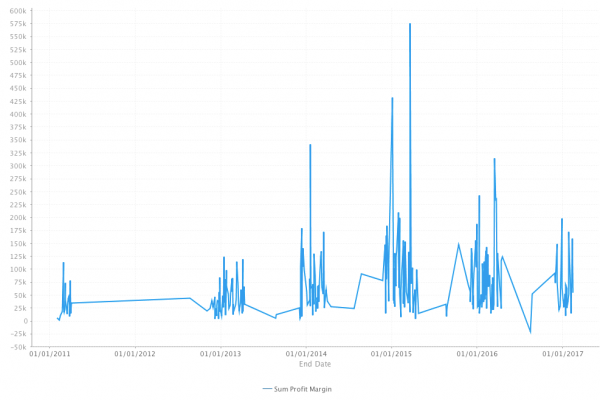
Let’s look at an example. The manager of a sports center wants to view the total profits made from his athletes at the end of each campaign period. The chart he creates displays this information in a continuous time flow.
However, he is only interested in how each quarter is performing. By changing the time data to discrete mode and choosing “Quarter” as the time unit, he is able to get a better understanding of his quarterly sales.
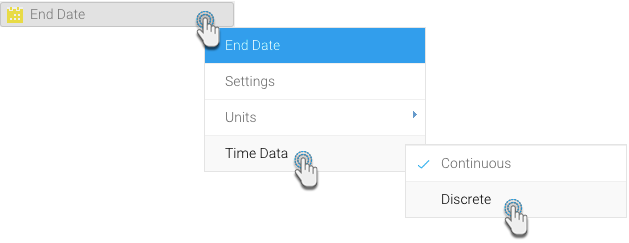
With a few clicks on his chart builder, he can effortlessly change the time data settings.
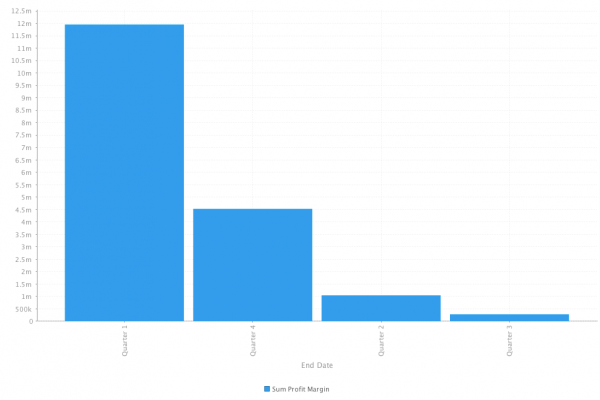
The chart now displays the aggregated result of each particular quarter.
This is just one of the new advancements being introduced in Yellowfin 7.4, set for release October 31.
![]()