

Yellowfin 9.2 Release Highlights
In this release, we’ve focussed on providing exceptional capability for our customers - both enterprise and software companies - to create and deploy embedded analytics experiences that drive user adoption with minimum amount of effort and coding.
Read the release notes and check out the video below to see some of these new enhancements in action:
Enhanced APIs for Embedded Analytics
Introduced in Yellowfin 9, the revamped JavaScript API is now generally available in this release. The new API brings new capabilities to both simple and intricate Yellowfin integrations into other applications:
- Improved user interface consistent with version 9 including filters, tooltips, and time-sliders
- Improved embedded interactivity with chart brushing, drill anywhere, and series selections
- Improved embed link functionality with expanded parameters
- New Base API allowing developers to use shorthand functions to load dashboard content
- New Advanced API to listen to and trap events including filter selections, drills, content run states, and much more
- New Sub APIs for dashboard objects including filters, filter objects, dashboard subtabs, reports, and more to provide fine-grained control over the user interface
This new API can be used for both embedding Yellowfin content and within Dashboard Code Mode in order to extend and customize your action based dashboards.
The new REST API also makes its debut in this release, providing support for administrators that want to automate back-end processes, perform administrative tasks and manage content programmatically. Importantly, the REST API also provides access to Yellowfin content for developers, enabling them to build custom experiences incorporating Yellowfin Signals, Stories, Timeline Notifications, Collaboration and more.
Dashboards & Presentations
One of the first things you may notice on your dashboards and presentations is a new toolbar icon.
![]()
This activates Full Screen Mode; enabling dashboards and presentations to utilize more screen estate by having the peripheral menus fade away. This is useful for customers who display real-time dashboards or conduct presentations on TV screens.
In Yellowfin 9, we introduced dashboard action buttons, enabling our customers to build custom and seamless operational workflows into their dashboards. Due to popular demand, we have expanded action button functionality to all other dashboard canvas widgets including text, images, icons, and shapes. Now any dashboard canvas widget can be made actionable and trigger events when clicked upon. As part of this enhancement, we have also added two new event types:
- Go to URL: navigating to an external URL
- Go to Sub Tab: navigating to any sub tab within a dashboard or slide within a presentation
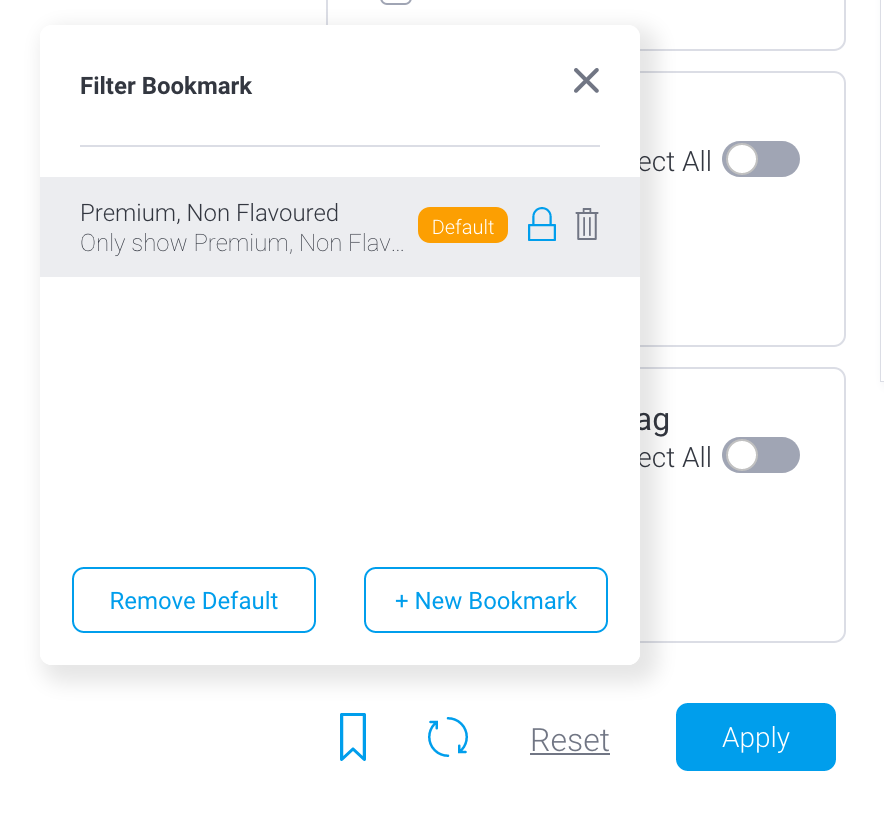
Another improvement is the introduction of default bookmarks. Dashboard consumers can now save personalized default filter bookmarks that will automatically be applied to the dashboard when first loaded, or if the dashboard filters are reset. These default bookmarks, both public and private ones, can also be shared with other users and groups.
In Yellowfin 9.2, dashboard reports’ columns can now be sorted in ascending or descending order.
For infographic dashboards which contain widgets layered closely or on top of each other, new settings have been added to control the visibility of menus that pop up on widgets - you can now set them to always show, never show, or only show when a user hovers on them - this can be applied to each widget and report on the dashboard.
We have also re-implemented and improved selected dashboard functionality. Dashboard authors can now include Associated Reports as a dashboard widget - adding associated reports as links in their dashboards, rather than displaying full reports. This new widget offers an enhanced drag-and-reorder experience and can be placed anywhere on the dashboard.
Filter values applied on the dashboard will also be retained when maximizing any report with similar filters, so you no longer need to re-apply them at the report level. Furthermore, we have added navigational buttons to quickly return to the dashboard.
Data Discovery
We have implemented multiple enhancements to improve the report authoring experience.
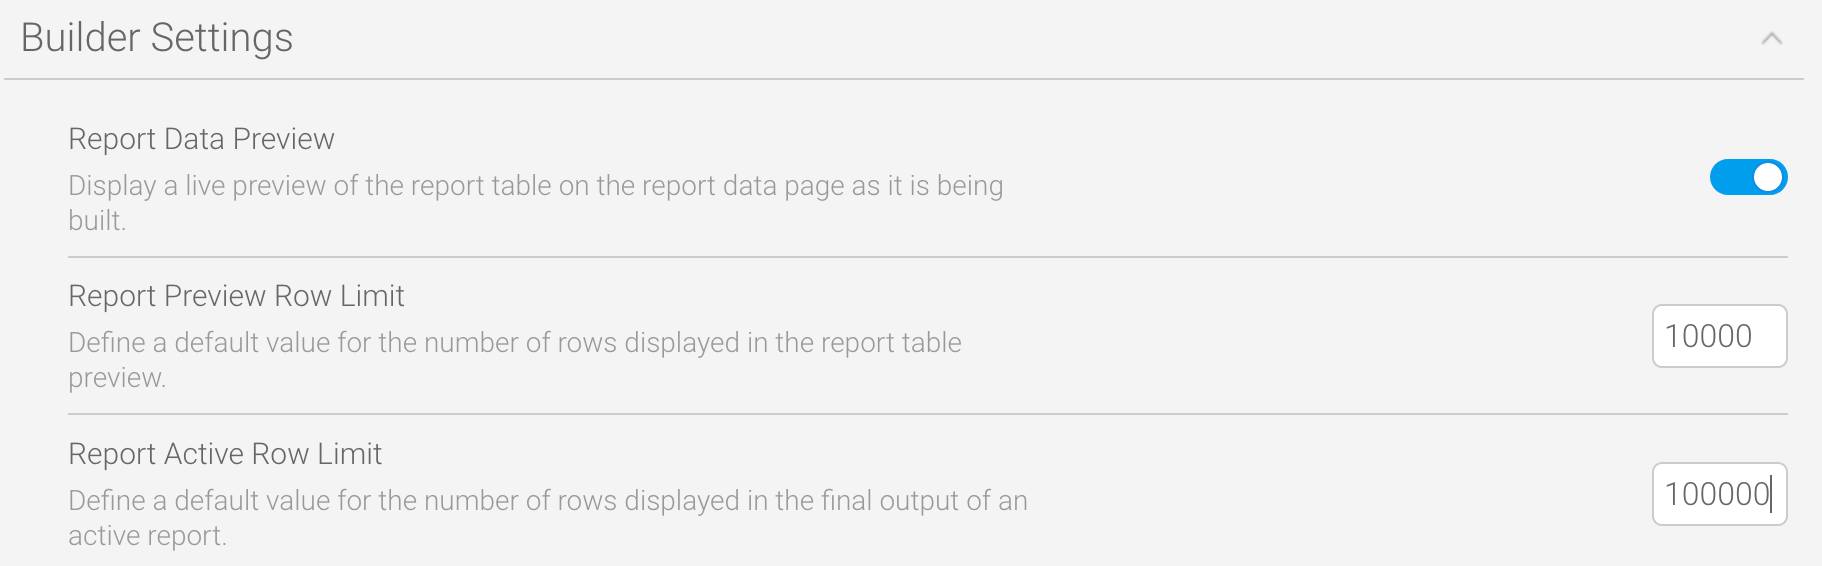
New administration configurations have been added to define default limits for the number of rows to preview data as it’s built in the Report Builder, and the number of resulting rows returned in active and published reports. These settings allow default limits to be applied to all reports, which can also be modified within individual reports.
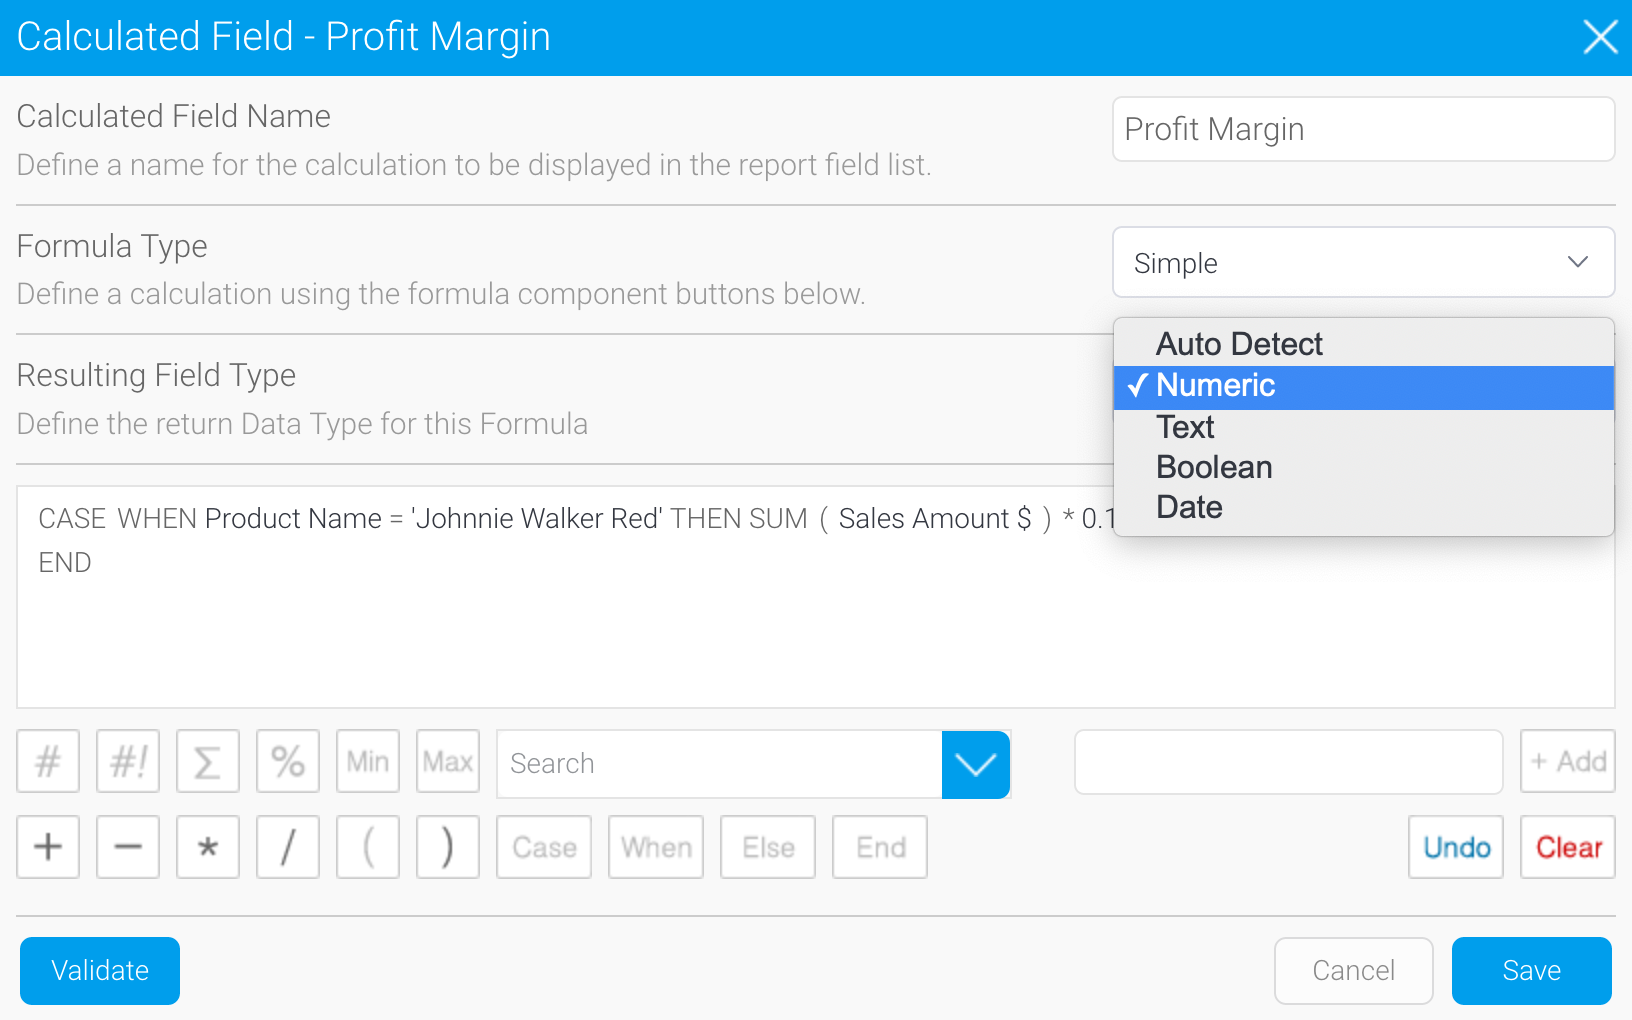
For calculated fields, it is now possible to define the derived data type (numeric, boolean, text, or date) upfront and skip the validation test; saving database validation time for complex and expensive calculations.
We have also introduced Dynamic Filter Values for report filters where the first value of any dimension filter is automatically applied in any report run. This is particularly useful in situations where the report consumer does not have the default filter value available to them - common in multi-tenant deployments with access filter restrictions.
For Broadcasting, a new Broadcast schedule type has been introduced. “Save to Disk” broadcasts allow report authors to set up scheduling that saves broadcast results on a local server path.
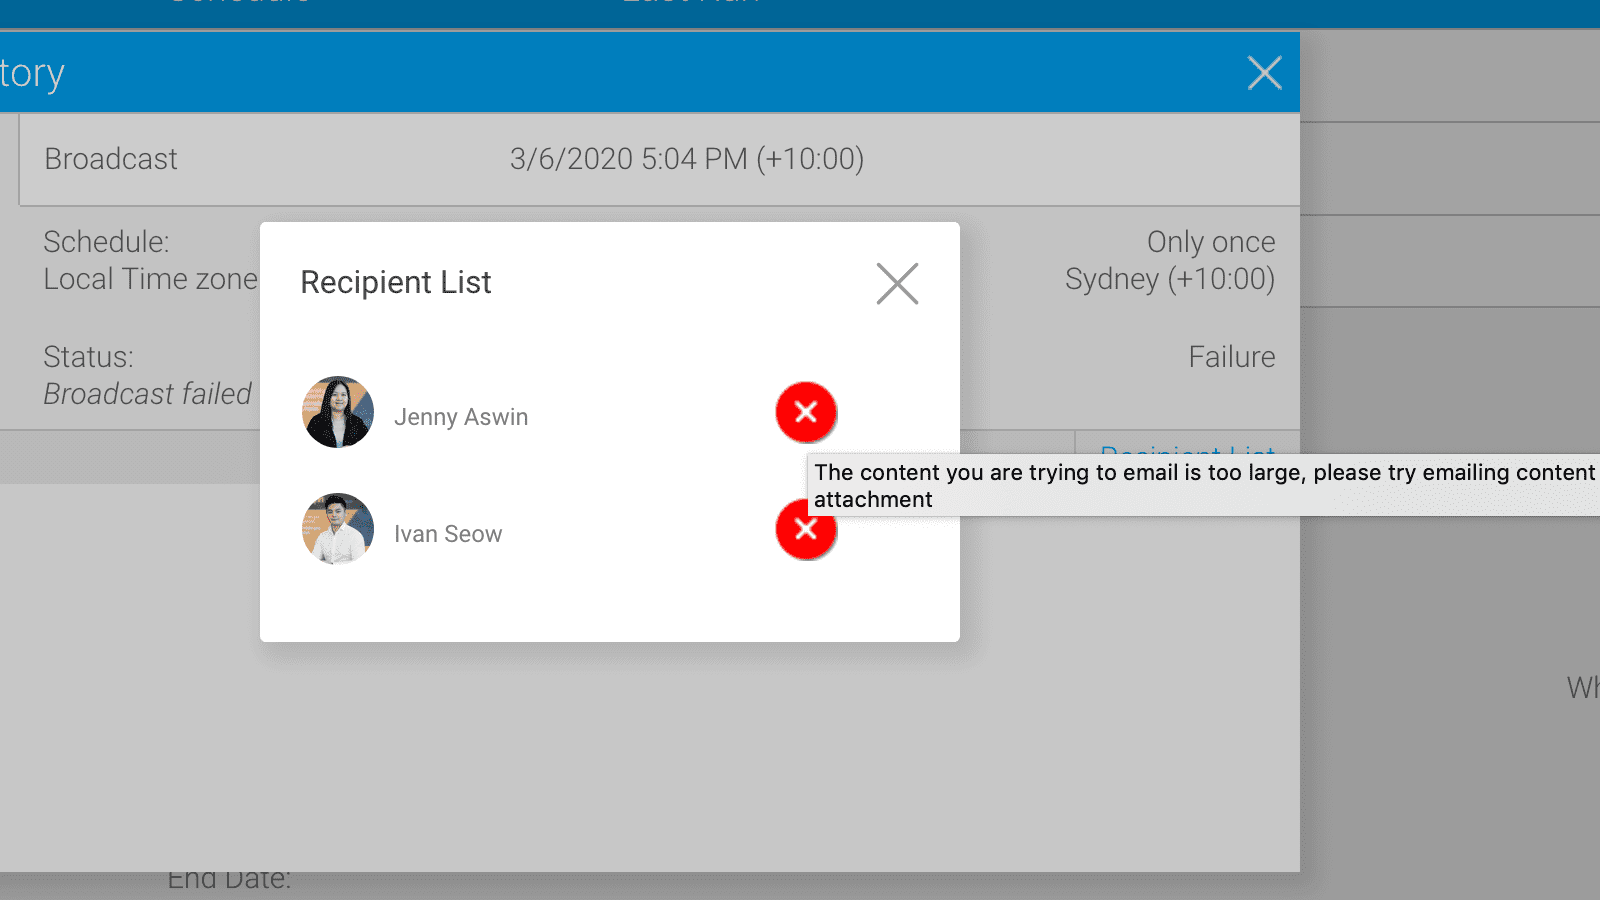
Another improvement in this area includes displaying historic runs for broadcast schedules where previously only the latest run was shown in Schedule Management. In this release, not only is each broadcast run listed in the new History tab - each run tracks and displays the full list of recipients - showing who successfully received content and who did not. For those who were unsuccessful in receiving broadcast content, it is now also possible to view the resulting error.
Step Change Signals
Introduced in Yellowfin 9, Step Change Signals are now generally available in this release.
A step change occurs when a time series of data moves from one stable pattern to another one that is either above or below the previous pattern and exceeding a threshold amount. While spikes and drops highlight rapid changes in data, step changes can highlight more profound and enduring shifts between stable periods.
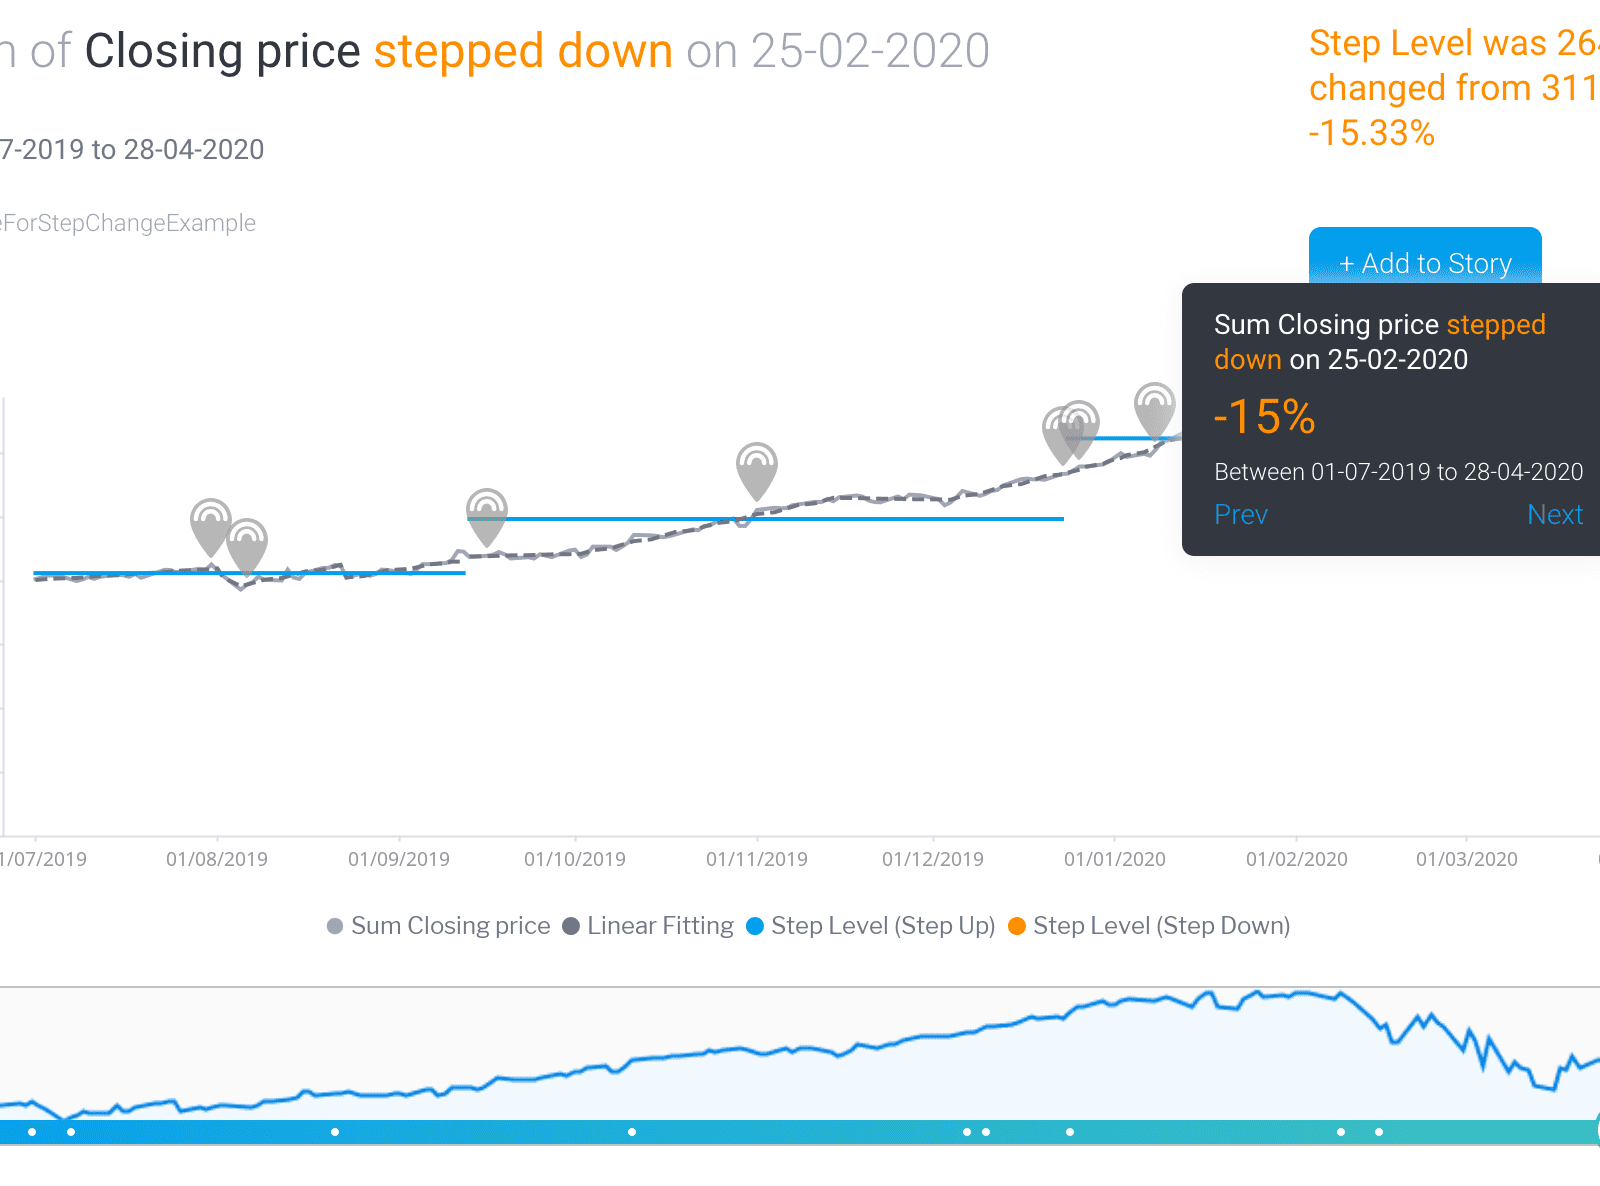
Part of the Signals algorithm library, this new algorithm now appears as a sub option within Outlier type signal jobs.
Learn more about Yellowfin 9.2
See how Yellowfin 9.2 provides business users with unique ways to engage with and act on their data, and addresses the needs of data analysts and developers who want to build and deploy amazing analytical experiences.