
How to create a stacked column graph overlayed with a line graph?
24 March, 2010
When using combination charts, is it possible to have a stacked bar graph? At the moment each of the series which I want stacked have their own separate bars.
Cheers,
Dave
Cheers,
Dave
Hi Dave,
No, at present there's no way of using different bar types for combination charts. This is something we'll look at doing in the future, though.
No, at present there's no way of using different bar types for combination charts. This is something we'll look at doing in the future, though.
Hi
Is this now possible with the yellowfin 7 version?
Cheers
Paul
Is this now possible with the yellowfin 7 version?
Cheers
Paul
Hi Yellowfin, Any updates on having what excel calls a "Stacked Column Chart" as the primary graph with a "Line Chart" as secondary graph, or the other way around in Yellowfin?
Hi All,
Thanks for the questions.
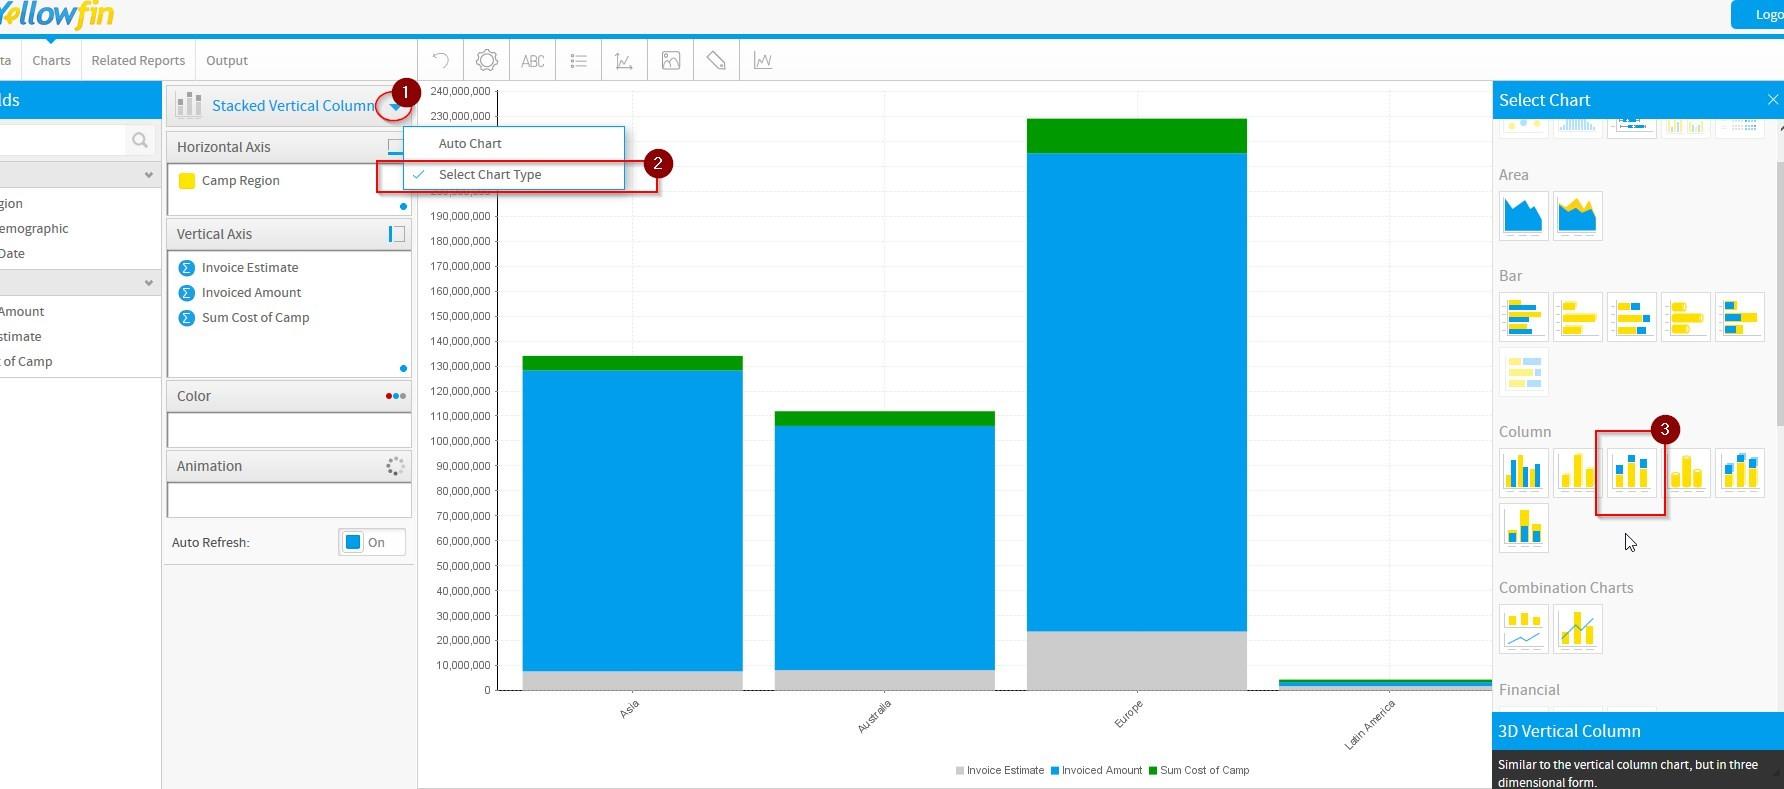
Paul and Original Poster - This is now possible in Yellowfin 7. You can create Stacked Column Charts by selecting "Select Chart Type" and choosing "Stacked Virtual Column". Please see screenshot below.

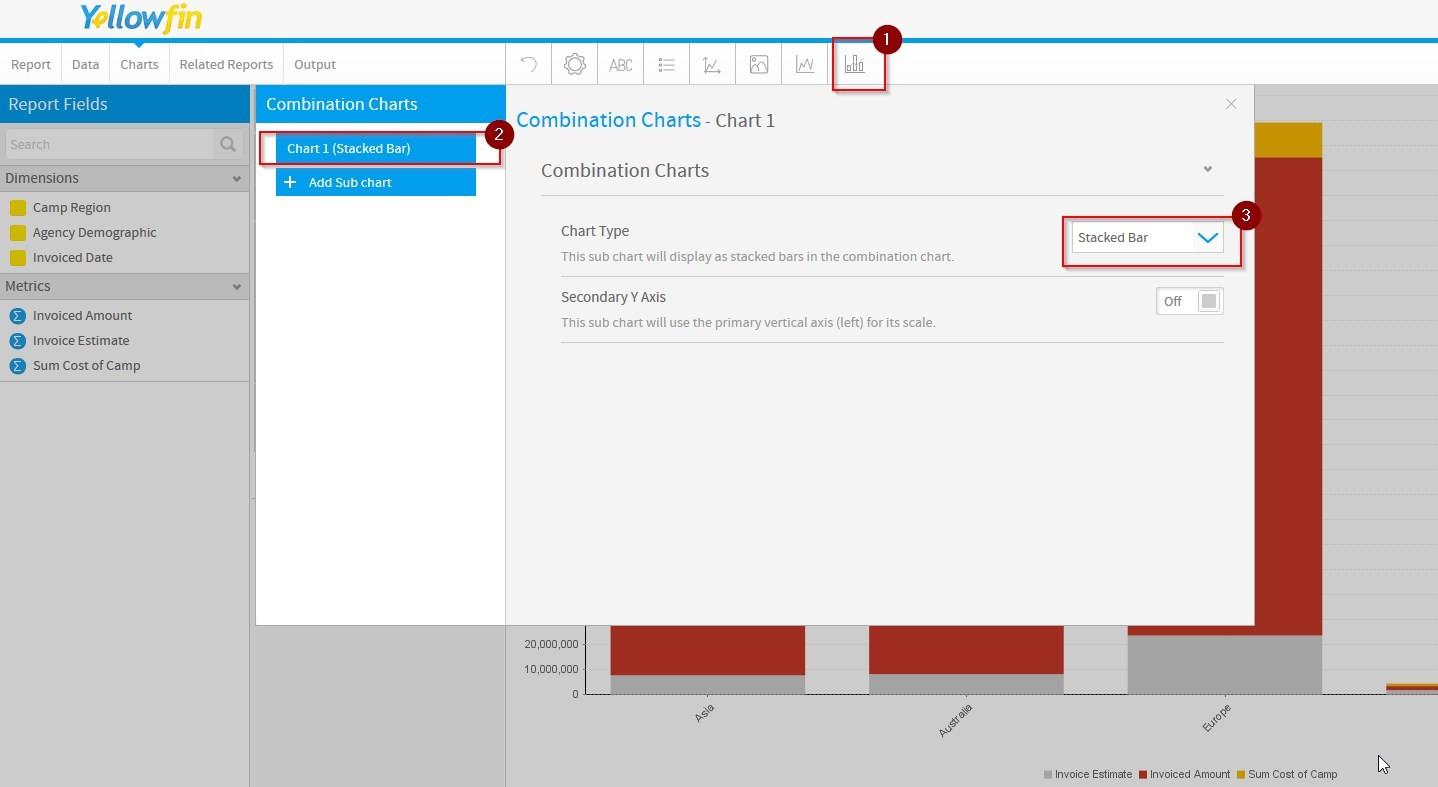
Anonymous Poster - Regarding Stacked Column charts with a line chart over the top, you can do this too.
1. Select the "Overlay Chart" type.
2. Add in all your data.
3. Select "Combination Chart" option > set Chart1 to "Stacked Bar". See screenshot.
For more help with Combination charts please see here:
http://wiki.yellowfin.com.au/display/USER71/Combination+Charts
I hope this helps.
Let me know if you have any questions.
Kind Regards,
Cadell.
Thanks for the questions.
Paul and Original Poster - This is now possible in Yellowfin 7. You can create Stacked Column Charts by selecting "Select Chart Type" and choosing "Stacked Virtual Column". Please see screenshot below.
Anonymous Poster - Regarding Stacked Column charts with a line chart over the top, you can do this too.
1. Select the "Overlay Chart" type.
2. Add in all your data.
3. Select "Combination Chart" option > set Chart1 to "Stacked Bar". See screenshot.
For more help with Combination charts please see here:
http://wiki.yellowfin.com.au/display/USER71/Combination+Charts
I hope this helps.
Let me know if you have any questions.
Kind Regards,
Cadell.
Please see updated answer above.
Yes can be done.