
Null values mapped to 0 on my line chart?
9 October, 2012
Hello,
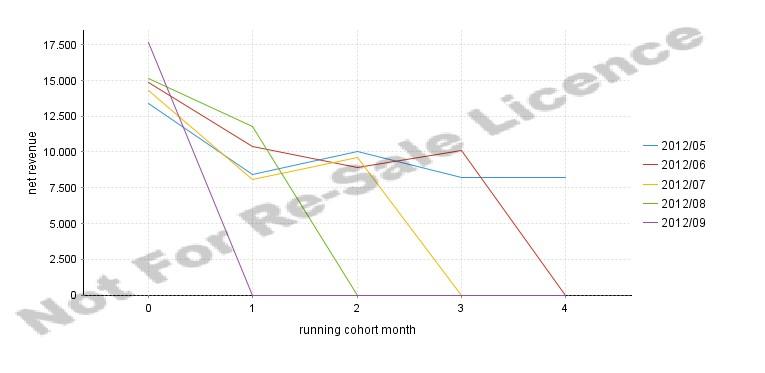
We are trying to create a cohort report with a line chart but the implemented default behavior seems to be, that null values are mapped to 0. What we need is a broken line instead.
According to the Yellowfin forum, there is no way to set the null value behavior in the line charts. Do you have a suggestion for a workaround?
It would be great if you could take this up as an enhancement request for the line chart settings.
Thank you!
Regards,
Hi,
When using line charts and displaying a period of time with null values, you will need to use a time-series chart to stop the drop-off's.
Having a chart a as time series chart, allows it to recognise that you are measuring across time and nulls can be present.
I hope this makes sense.
An enhancement request has also been created so we can try to implement a way around this in future builds (TASK ID = 119733)
The following post may also provide some additional information:
How do I account for future values in a line chart with nulls?
Regards,
David
Hi David,
In our case we were able to use the time chart work around. Since the categories of our line chart are integers, we could convert them to "fake" dats like 1 -> 01.01.0001, 2 -> 01.01.0002 and so forth. That worked for us.
Still it would be great to get an option with a similar behavior for regular line charts, too.
Regards,
Ingo