Data visualization probes Eurovision wins by populace & GDP
By Eshan Wickrema and Lachlan James
What factors might impact a nations’ success rate at Eurovision? Does population and GDP play a role?
Eurovision winners vs population (1956 – 2014)
Note: Chart is sorted in descending order by number of wins
Insights
- Size doesn’t matter. Micro countries with meagre populations – such as Monaco (37,000), Estonia (1.3 million) and Latvia (1.9 million) – have produced winning performances at Eurovision
- In fact, Luxembourg is tied for equal second on the all-time Eurovision leader board, with five wins, despite its tiny population (570,000).
- European giant, Russia, with a population of 144 million, are at the bottom of the winners list, having only managed a solitary Eurovision title (Eurovision 2008, Dima Bilan; “Believe”)
- Competition leader, Ireland (7 titles), has the fifth smallest population out of any Eurovision winning nation (4.6 million).
Size doesn’t matter (at egalitarian Eurovision at least, anyway)
In our last Eurovision data blog, Data visualization shows Eurovision success rates by country, we found a relationship between the number of Eurovision entries and the number Eurovison of victories. This discovery suggested that, albeit with sizeable exceptions, you’ve simply got to be ‘in it to win it’. But, we wanted to dig a little deeper – to unearth other factors that may impact Eurovision success.
But, Business Intelligence and data visualization have shown no evident correlation between popluation and the number of wins per country at Eurovision. The fact that Ireland (7 wins) and Luxembourg (5 wins) sit atop the all-time Eurovision winners table, with the second (570,000) and fifth (4.6 million) smallest population of any nation to win Eurovision, says it all. So if the number of people from which to choose Eurovision representatives seems to have little impact on nations’ Eurovision success, do economic factors exert a greater influence?
In our Eurovision data blog Data visualization shows most successful Eurovision nations, we hypothesized that GDP per captia might play an important role. The blog posited that: “Analyzing the list of winners from a geographic perspective adds another dimension to the insights gleaned, revealing that the tournament has been dominated by countries from northern and western Europe. Perhaps this pattern is indicative of the fact that countries with higher GDP per capita generally have the ability to dedicate more resources towards leisure and entertainment related activities.”
So, were we onto something here?
Eurovision winners (1956 – 2014) vs GDP per capita (current day $US figures)
Note: Chart is sorted in descending order by number of wins
Limitations: GDP per capita figures are the latest provided by the International Monetary Fund (IMF), and so do not take into account the changing fortunes of countries over time (some economies have boomed, whilst others have waned or disappeared, over the last 60 years). In addition, data for the now non-existent Yugoslavia had to be secured from other sources, as it does not appear in the IMF’s current GDP world rankings.
Insights
- Countries that have won two or more Eurovision titles have an average GDP per capita significantly higher than those nations with one Eurovision victory
- Of the nations that have won two or more Eurovision titles, the country with the lowest GDP per capita is Spain ($31,946)
- Of the nations that have secured only one Eurovision win, the country with the lowest GDP per capita is Ukraine ($2,542)
- Monaco is the biggest outlier in this dataset, with the world’s highest nominal GDP per capita ($164,189), despite only having won one Eurovision crown
- Luxembourg best exemplifies the relationship between per capita GDP and Eurovision victories, sitting second on the all-time Eurovision winners list (five triumphs from just 37 attempts), as well as second on the GDP per capita ranking ($104,512)
Buying Eurovision success?
With a clear concentration of wealthier countries in the top half of the Eurovision all-time winners list, can Eurovision success be bought? Like many non-essential pursuits, or leisure time activities, higher levels of disposable income usually allow people to advance artistic skillsets.
The Eurovision winners list reflects this general principle:
- Countries with three or more Eurovision wins have an average GDP per capita of $55,494
- Countries with two Eurovision wins have an average GDP per capita of $44,954
- Countries with one Eurovision win have an average GDP per capita of $30,806 (and that’s even including Monaco, with the world’s highest GDP per capita, at $164,189)
Where to next?
Having established that it’s not the number of people, but how ‘well-off’ the average citizen is, that impacts a nations’ Eurovision success, what other Eurovision insights can we unearth?
Well, you’ll just have to keep watch for the next instalment of Yellowfin’s Eurovision data blog series – coming (really) soon.
We recommend
Data visualization shows Eurovision success rates by country >
Data visualization compares Eurovision winners & runners-up >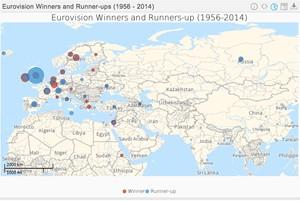
Data visualization reveals most unlucky Eurovision nations >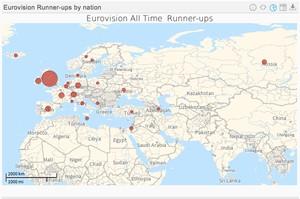
Data Visualization reveals advantage of hosting Eurovision >
Data visualization shows most successful Eurovision nations >
Data visualization reveals success by gender at Eurovision >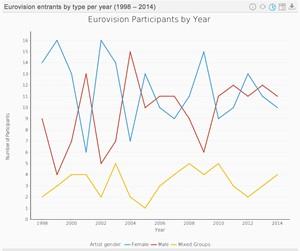
Data visualization ’exposes’ nudity in Game of Thrones >
Data Visualization reveals most popular Game of Thrones episode >
Data Visualization: Game of Thrones the most pirated TV show >
Data viz predicts 2015 Cricket World Cup high scoring games > 
Data visualization predicts 2015 Australian Grand Prix > 
Assessing Daytona 500 championship with Data Visualization >