

Data doesn't speak for itself: Why data storytelling is so important
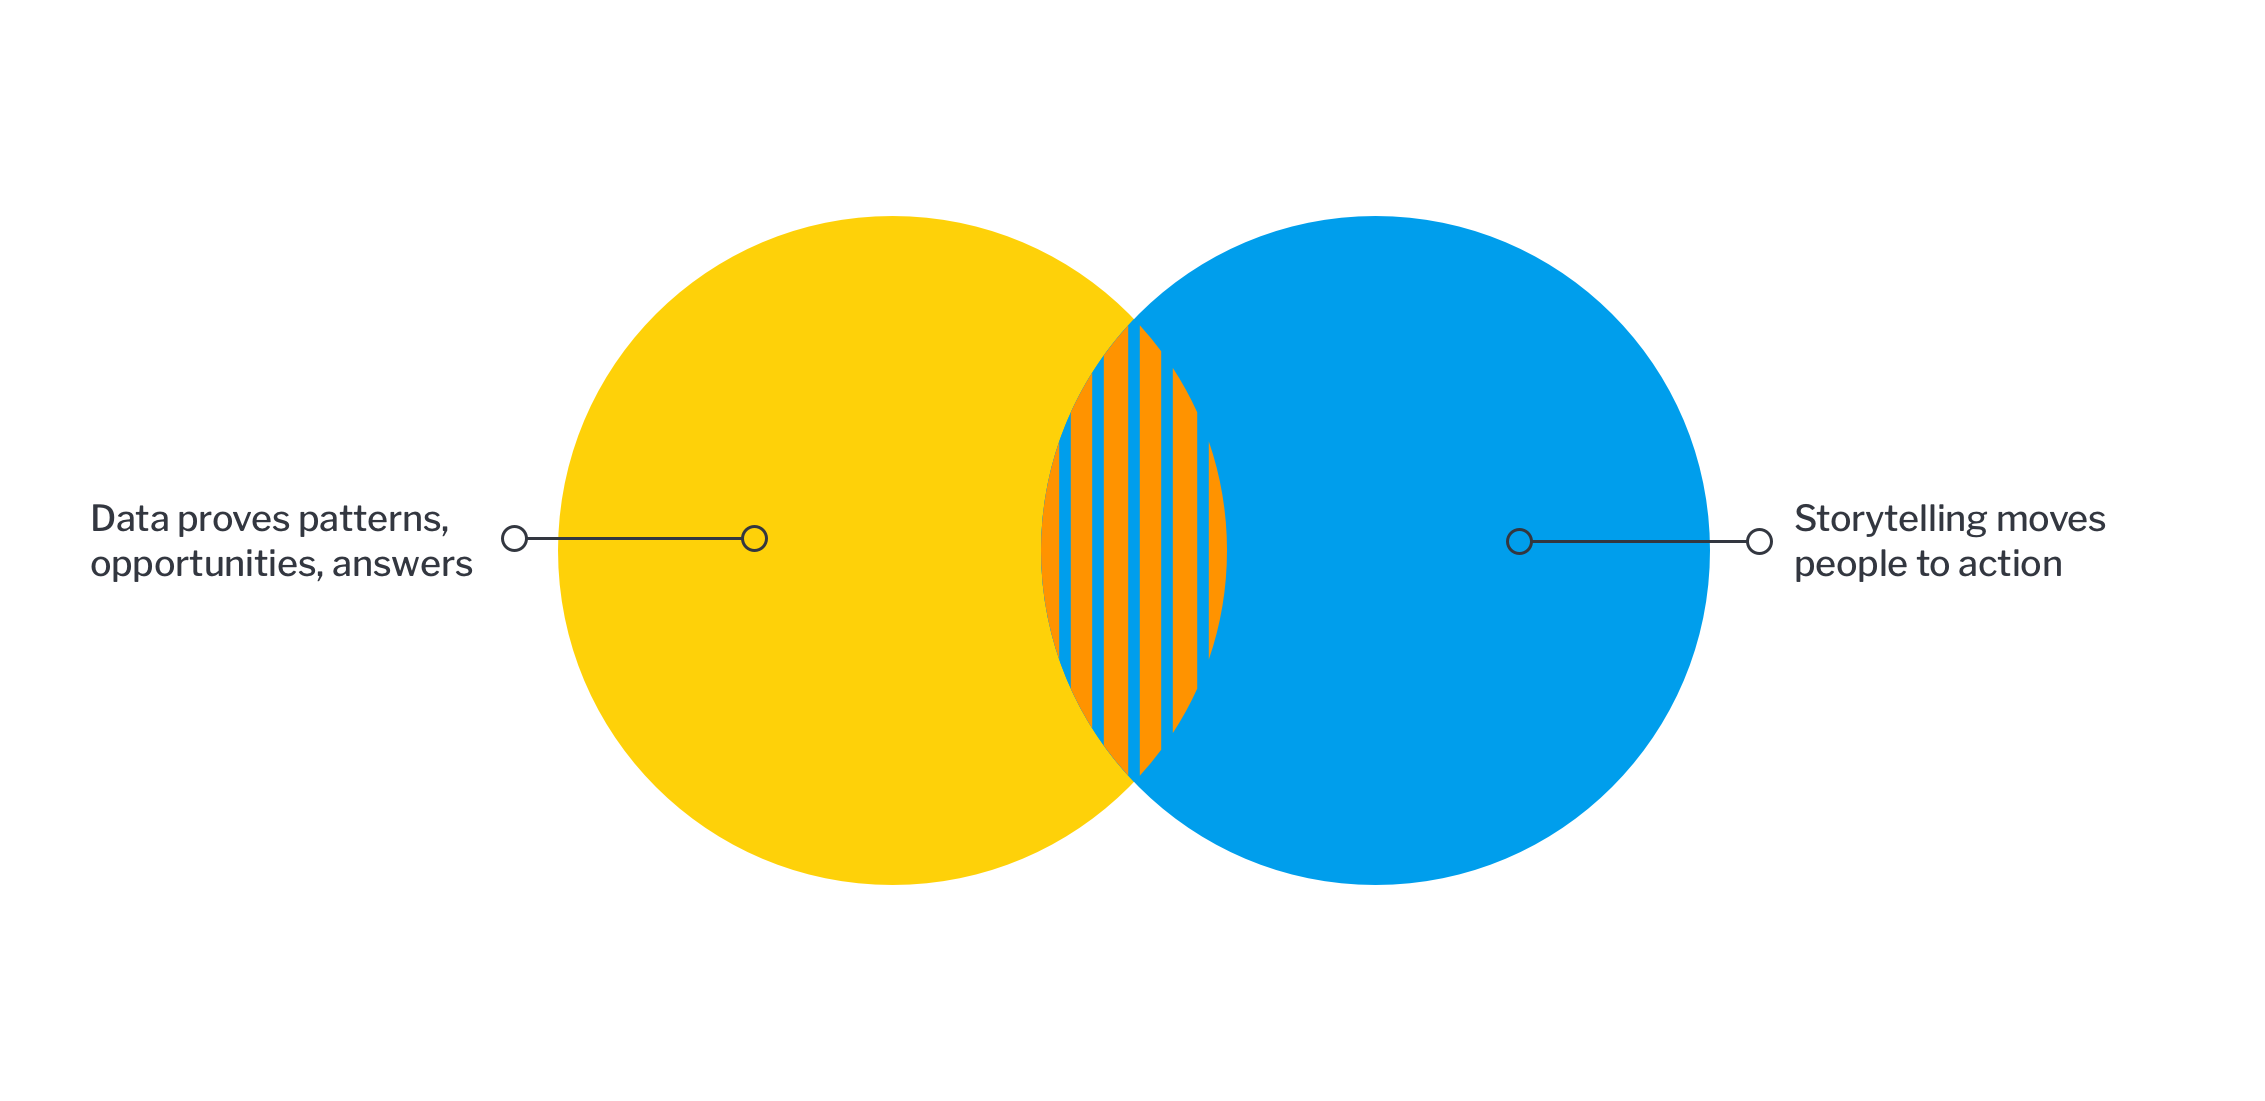
“Letting the data speak for itself” is a well known phrase with a hard truth: Data presented on its own rarely communicates meaning for itself. For most people, it’s the context behind the numbers, the story, that helps us understand and care to act.
Almost all data is a recording of past events - what has happened before. People have to explore and analyze it to find historical truth, in the hopes it can reveal trends, inform the next direction to take, and act as a guide for the actions necessary to improve the future.
For analysts in an organization who can read data presented as is - on dashboards, reports, charts - this traditional analytical process may be enough to make sense. But not everyone can consume or understand data shown upfront, or extract value from it.
Helping everyone understand what’s happening and getting them invested in taking action to get toward your ideal state, then, can only occur when you use the right skills and right analytics tools to not only communicate the data well, but make it memorable.
This need is why data storytelling is so important right now - especially because telling stories with data will be the most widespread way of consuming our analytics by 2025.
7 reasons why data storytelling is a critical analytics practice
In this blog, we want to focus on the many reasons data storytelling is as important as any other modern analytics initiative in helping your users make decisions today.
#1 - Storytelling accelerates the most from 'what' to 'why'
Firstly, to make data more useful for decision-making for people who aren’t experts, it must be given a clear and compelling voice. Problems and opportunities (the what) may just be numbers on a dashboard at this point; possibly interesting, but not clear for everyone on what to do next.
Combining narrative with data is a great way for organizations to better explain the ‘why’ behind the results, and tell an engaging story of how an insight was discovered or conclusion was drawn, so everyone can connect with and understand why it’s important:
- Why does this data point, pattern, trend, etc prove your point?
- Why is this data informing the next decision to take?
- Why should I care about it?
These complex questions aren't so easily conveyed in dashboards or charts alone. The answers require nuance, interpretation and sometimes arguments, for people to ‘get’ it.
Because storytelling is a fundamental human skill and proven way of articulating information, deploying it as part of the analysis process enables you to better blend data with written and visual communication, and provide more direct answers around insights.
It’s why Yellowfin offers Stories and Present, dedicated data storytelling products of the Yellowfin BI suite, to allow all users to explain and consume discoveries in a long-form or presentation-friendly medium, as part of their everyday analytics experience.
#2 - Narrative and data are sweet-talkers for change
When people better understand the ‘why’ - the context or results - the next step is getting them to change, influence, or inspire their next decision, and how they make it.
The point of sharing findings from data is to move from identifying a problem or opportunity toward a resolution or action. But different audiences require different levels of evidence, and may only act if you persuade them to do so. Combining storytelling with data aids this process.
Regular business users may not get anything out of your in-depth dashboard filled with visualizations, but they may feel compelled to act after consuming a story with your personal perspective on a discovery that sheds light on the context behind the numbers.
Similarly, people who appreciate hard numbers over anecdotes will be convinced by a story that combines analysis with a detailed technical breakdown. A standard report may provide evidence, but it’s the opportunity for a longer-form narrative that inspires action.
#3 - Data stories help create a data-driven culture
Bringing data from operational dashboards, countless tables, and complex charts into a story isn’t just valuable for the added context it provides (which numbers on their own can’t), but in its ability to create a more data-driven culture throughout your organization.
Many companies adopt embedded BI to not just have the latest tools, but to ensure everyone in the business gets on the same page around what's happening and why.
Having a platform that provides in-built storytelling capabilities as part of the analytics experience means everyone in the business has tools to explain their findings, build a case for some course of action, and back up recommendations with detailed answers.
Most importantly, it encourages a more data-driven mindset for everyone, experts or regular line-of-business users, when communicating new discoveries.
Read more: How to create a data culture through data storytelling
#4 - Data stories compliment automated, augmented insights
The importance of storytelling and narrative to explain the numbers and get people invested may seem like a core expectation from any analytics solution, but for many analytics users, it’s not as obvious as it seems - especially with so many augmented BI features taking the limelight.
Today’s analytics solutions offer streamlined AI, automation, and machine learning capabilities, which open up new and amazing ways to analyze our data and find opportunities. From automated business monitoring to augmented analytics to contextual analytics, modern embedded BI platforms are augmenting how regular users search the numbers for answers.
But not all answers come from machine algorithms or automated alerts, nor are they always guaranteed to be easily understood. Oftentimes, the deepest insights are through sharing personal perspective, argument, and expertise. But combining these powerful augmented tools with a data story that unearths context only further increases your users’ ability to decisively act.
A comparison of regional sales performance generated by machine-Assisted Insights, for example, can help get a non-expert started on finding a pattern. But is it good? Is it expected? Which direction should you take? Practicing storytelling as an extension of the augmented process allows for users to weigh in with their commentary, and build further trust in the results.
#5 - Narrative helps build trust in your data discoveries
Data is about what has already happened, not what could happen, and relying too much on historical data to anticipate or shape the future can limit potential insights and action.
For example, predicting target performance based on trend lines alone, even if they appear clear, won’t always be reliable, and it may not be convincing for everyone.
Making a good argument, recommendation or point around data to drive your audience to action needs more than just presenting the numbers that prove or disprove your hypothesis. Think of it as the starting point. A compelling argument proposes which decision should be made, and using a data story allows for a more persuasive case for the proof-point you found in the data.
One source of confusion around data storytelling is whether it is creative license that brings bias into conclusions. Ultimately, data storytelling is firmly about using creative thought to inspire the best actions to take next, and only after confidence in the truth the data shows is well established.
#6 - Increase stakeholder engagement and buy-in
Conveying an unseen problem or exciting opportunity in the data isn’t just limited to compiling information in an operational dashboard anymore.
With storytelling such a big part of modern BI solutions, informing your client about their results using a compelling visual and textual narrative (backed by the data) can not only better demonstrate the analytical value you bring them, but help increase their engagement with your analysis, which can lead to more consistent long-term buy-in.
#7 - It brings insights to your people, faster
In the era of big data, data preparation and analysis is time-consuming. There’s collection, cleansing, and visualization to consider before you can share insight with stakeholders and customers. They need answers, but sharing straight quantitative analysis is sure to put them to sleep.
Simply put, not everyone wants or needs the full spectrum of the analytics journey to understand an insight and take action. Data storytelling is thus growing to be another effective method to communicate discoveries and inspire action from detailed analysis in a more succinct, engaging manner.
Data-led stories don’t have to be longer-form; they can be just as high-level as a dashboard, but with the addition of long-form text, video and images to make it more detailed and interesting.
Why data storytelling is so important: Key takeaways
For those well-versed in dissecting data presented in operational dashboards, it’s easy to forget not everyone can understand or gain value from data presented as is. A line chart that shouts clear seasonal variation to you may simply confuse others you share it with.
But your audience's difficulty in gleaning insights from data doesn’t necessarily mean they are unable to understand, but a sign they have a different depth of knowledge about data analysis that needs to be catered to. Taking the time to explain the results in another way, such as through a data story, may seem like an exercise in oversimplification, but for them, the answers will be both useful and more clear.
Frequently Asked Questions About Data Storytelling
1. What is data storytelling and why does it matter?
Data storytelling is the practice of combining data, visuals, and narrative to explain insights in a way people can understand and act on. It matters because raw data alone rarely communicates meaning. Most decision-makers need context around why something happened and what it means for the future, not just numbers on a dashboard.
2. Why can’t data “speak for itself”?
Data usually represents past events and patterns, but without interpretation, it leaves room for confusion or misinterpretation. Charts and dashboards show what happened, but they don’t explain why it happened or what should be done next. Storytelling bridges this gap by adding explanation, reasoning, and context.
3. How does data storytelling improve decision-making?
Data storytelling improves decision-making by translating complex analysis into clear insights that stakeholders can easily understand. When people grasp the reasoning behind the numbers, they feel more confident taking action, aligning strategies, and committing to decisions based on data rather than intuition alone.
4. What is the difference between data storytelling and data visualization?
Data visualization focuses on displaying data through charts, graphs, and dashboards. Data storytelling goes further by explaining the significance of those visuals through narrative. While visualization shows patterns, storytelling explains why those patterns matter and how they should influence decisions.
5. Who benefits the most from data storytelling?
Data storytelling benefits non-technical stakeholders the most, including business leaders, managers, and operational teams. However, analysts also benefit because storytelling allows them to communicate insights more effectively, gain buy-in, and demonstrate the real impact of their analysis.
6. How does data storytelling help create a data-driven culture?
By making insights accessible and understandable, data storytelling encourages more people across an organization to engage with data. When teams can clearly explain and discuss insights, data becomes part of everyday decision-making rather than something only analysts interact with.
7. How does data storytelling work alongside AI and augmented analytics?
AI and augmented analytics help identify trends, anomalies, and patterns automatically. Data storytelling complements these tools by adding human interpretation, judgment, and context. This combination helps teams understand whether insights are expected, meaningful, and actionable rather than blindly trusting automated outputs.
8. Can data storytelling increase stakeholder engagement and trust?
Yes, data storytelling builds trust by clearly explaining how insights were discovered and why conclusions were drawn. When stakeholders understand the logic behind recommendations, they are more likely to engage with the analysis, ask better questions, and support data-driven initiatives.
9. What are common mistakes organizations make with data storytelling?
Common mistakes include relying only on dashboards, overloading visuals with too much information, skipping narrative explanation, and failing to clearly state the takeaway. Effective data storytelling always connects insights to real business decisions and next steps.
10. Why is data storytelling becoming more important in modern analytics?
As data volumes grow and analytics tools become more advanced, insights are no longer limited to analysts. Data storytelling is becoming essential because it enables organizations to communicate insights quickly, clearly, and persuasively to a wider audience, making analytics more actionable and impactful.
Whitepaper: Data Storytelling - The Power of Using Narrative to Influence and Engage the Business
Demystify the conversation around data storytelling, and understand its usefulness for all types of analytics users in our free whitepaper today.