

Types of Dashboards: Operational, Strategic, Analytical & More
TL;DR
You need dashboards to turn big data into quick, smart decisions. But with operational, strategic, and analytical dashboard options, choosing the right one is crucial for BI success. This post cuts through the confusion to reveal which types of dashboards are the absolute best fit for your organization.
Key takeaways for types of dashboards
- Dashboards drive decisions: Convert metrics into actionable visuals for faster outcomes.
- Know the five types: Operational, strategic, analytical, tactical, and contextual.
- Target audience: Align the dashboard type to its user, from executives to frontline staff.
- Embed for efficiency: Embedded dashboards deliver insights right within your SaaS apps.
- Strategic selection: The right choice depends on your user profile, data needs, etc.
See all the types of dashboards Yellowfin has to offer with a free trial.
Why do you want to use a BI dashboard?
It’s simple: Business performance dashboards translate raw data into timely, precise decisions. They consolidate operational data from multiple sources into a single, intuitive interface. Modern business professionals need real-time insights to make decisions quicker.
Yellowfin dashboards cater to this demand by embedding analytics directly into your application, providing the contextual data your end-users need where decisions are made, and exactly when they need to act.
What makes a great BI dashboard?
A great dashboard must motivate, educate, and deliver real business value. The five core qualities that form a great BI dashboard component include:
- Clarity: Data is presented in instantly understandable formats.
- Relevance: Focus only on KPIs that deliver specific business value.
- Interactivity: Enable users to filter, drill-down, and explore the data via contextual actions.
- Timeliness: Data updates are current or near real-time.
- Accessibility: Easily reached via multiple platforms or embedded directly in your end-users’ work process.
How many types of business intelligence dashboards are there?
Usually, there are three different types of dashboards. They are:
- Operational dashboard
- Strategic dashboard
- Analytical dashboard
In addition, certain embedded analytics solutions offer a fourth type of dashboard that deeply integrates action, context and automation into the regular dashboard workflow. At Yellowfin, we call it:
- Contextual dashboard
- Tactical dashboard
Other specialized variants, such as inventory dashboards, are also used in specific industries to track stock levels, supply chain metrics, and fulfillment performance.
Let's dive into each type of dashboard below.
1. What is an operational dashboard?
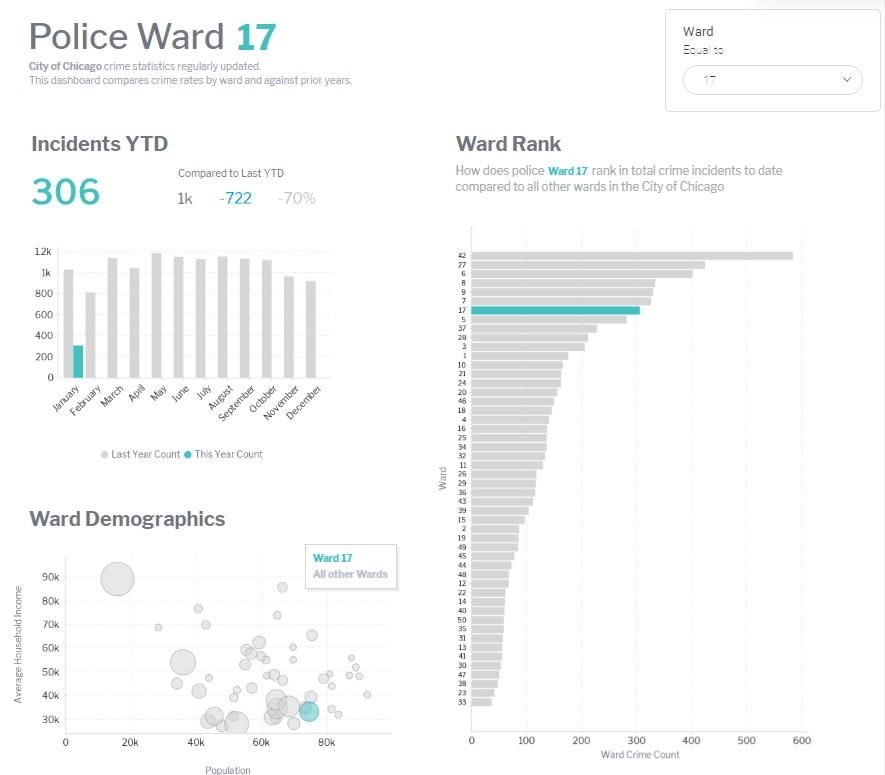
A great operational dashboard example is included in Yellowfin's Interactive Dashboard Gallery, which allows you to interact directly with our sample data. The Ward Benchmarks Dashboard shows off statistics comparing crime rates by ward against the prior year.
Is it the right type of dashboard for me?
Yes, if you are a manager or business professional who needs daily KPI monitoring and the ability to act quickly to sustain operational efficiency.
2. What is a strategic dashboard?
A strategic dashboard tracks long-term company performance against enterprise-wide goals. It provides executives with high-level summaries of KPIs (across months, quarters, or years) to assess strategy, identify trends, and guide decision-making.
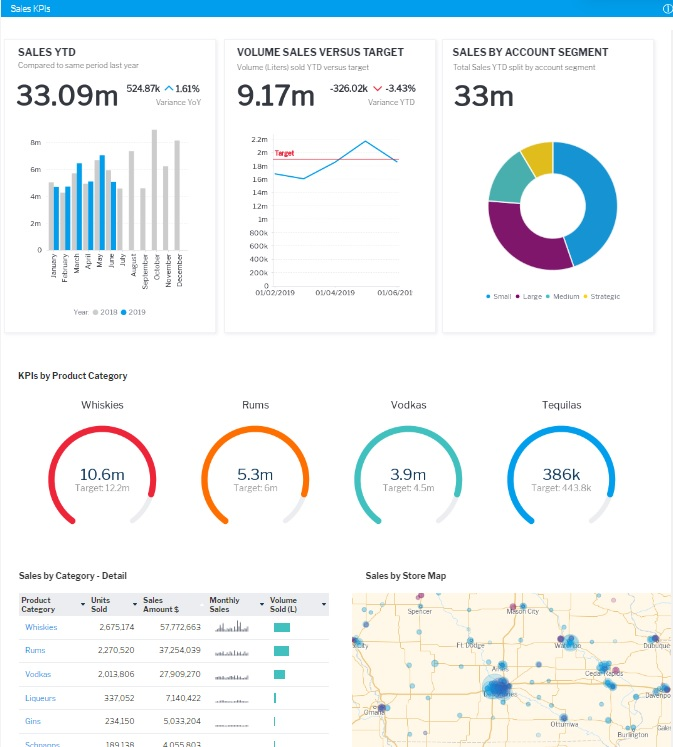
Strategic dashboards typically analyze large datasets to deliver comprehensive insights and are a little more complex than other types of dashboards. Strategic dashboard examples include executive scorecards, financial performance summaries, and corporate goal trackers. They help leaders align operations with strategy while optimizing costs.
Is it the right type of dashboard for me?
Yes, if you are senior management (CEOs, VPs) who must track enterprise-wide progress and steer long-term corporate strategy
3. What is an analytical dashboard?
Analytical dashboards are designed for deep analysis, using complex and historical and complex datasets to uncover trends, comparisons, and predictions. It differs from operational views by emphasizing features like filters and drill-downs that simplify large data volumes.
This advanced analytics dashboard often integrates predictive models and machine learning (ML) for better insights. Examples include Google Analytics dashboards and sales analysis dashboards that reveal trends across time, regions, and product categories.
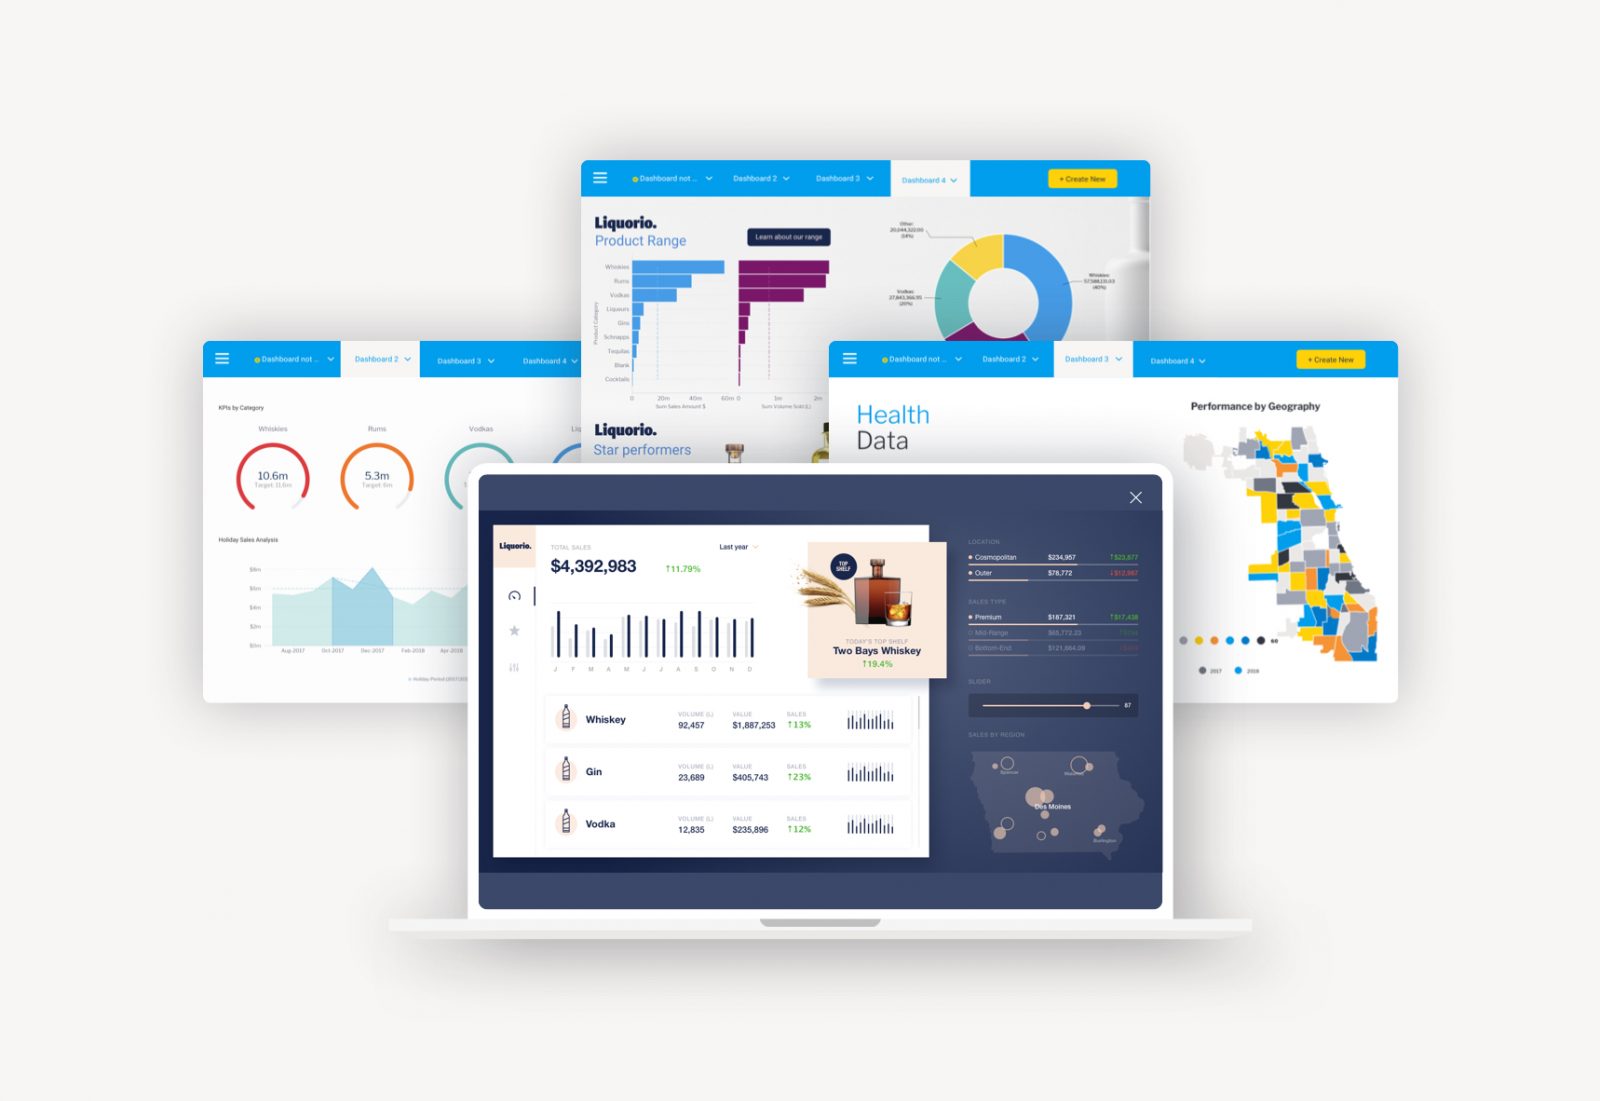
A great analytical dashboard example is included in Yellowfin's Interactive Dashboard Gallery. The Liquorio Sales Dashboard provides performance analysis for sales across distributors, product ranges and specific categories to support the sales team in finding changes and outliers in an otherwise large dataset.
Is it the right type of dashboard for me?
Yes, if you are an analyst, data scientist, or business manager comfortable with statistics and data visualization. Analytical dashboards are valuable for identifying patterns and making data-driven strategic decisions.
4. What is a contextual dashboard?
A contextual dashboard is a specialized analytical dashboard centered around delivering contextual insights. It combines data with interactive and AI-powered actions to trigger workflows directly within the same interface, eliminating the need to switch applications.
By embedding contextual dashboards into software applications, your users can interact with data, apply filters, and act on insights with greater efficiency and context unlocked.
How does a contextual dashboard work?
Contextual dashboards function by:
- Being embedded within application pages
- Synchronizing with the core application
- Supporting transactional workflows
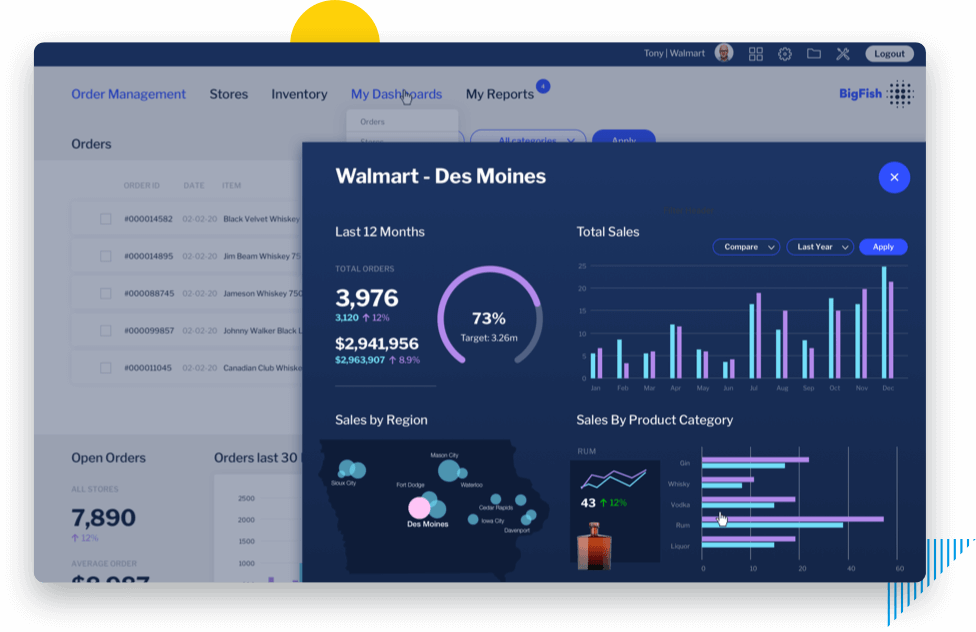
For example, in a CRM system, a contextual dashboard can display a customer’s purchase history with charts and KPIs filtered for that record. Similarly, in a management dashboard, it can deliver personalized insights across departments, helping decision-makers act quickly within their workflows.
Certain BI solutions, like Yellowfin, provide additional contextual actions with the use of AI-powered analysis tools, such as our Tell Me About My Data feature.
Related reading: From What to Why: How Contextual Insights Elevate BI
5. What is a tactical dashboard?
This dashboard is for mid-term strategy tracking and performance evaluation. It helps middle management ensure departmental goals are met by combining KPIs with resource tracking and project timeline analysis. It's essential for team leads who need to monitor ongoing work and course-correct to align with overall strategy.
Some tactical dashboard examples include project management dashboards, departmental performance trackers, and resource allocation monitors used in fast-paced operational environments.
Best practices for using BI dashboards
Achieving a dashboard's full potential requires discipline. Don't just show data, make it actionable by following these core principles:
- Know your audience: Tailor dashboards (e.g., marketing, operations) to specific professional and role-based needs.
- Focus on KPIs: Zero in on essential metrics; skip superficial data points.
- Design for clarity: Use visual hierarchy and consistency for immediate comprehension.
- Use interactivity wisely: Strategically add filters and drill-downs for self-service BI.
Building high-performing dashboards of many types isn't guesswork - it's a process. To move beyond best-effort attempts, you need an established blueprint. Get the complete framework, including the top 10 best practices, layout optimization tips, and more with our definitive Yellowfin Dashboard Best Practice Guide.
How to create a BI dashboard
Building an effective BI dashboard is a multi- step process that ensures your data is effectively visualized and aligned with your business goals:
- Define the goal: Clearly establish the business question the dashboard must answer (e.g., sales performance, management review).
- Know the audience: Each dashboard must reflect the data understanding capacity of its targeted users.
- Identify the right data: Obtain and utilize clean, precise, and relevant data sources.
- Select KPIs: Choose key metrics that directly serve your established business objectives.
- Design the layout: Sequence dashboards and widgets for a clear visual hierarchy.
- Make it interactive: Add strategic filters, drill-downs, and guided actions for self-service.
- Test and iterate: Continuously improve the dashboard based on real-world feedback.
Need a step-by-step guide? We recommend our visual walkthrough: How to Create a Dashboard in Yellowfin.

Conclusion
Dashboard selection is a strategic decision, driven by business targets, user preferences, and data needs. Each dashboard type services a specific function.
Yellowfin provides full support for all main dashboard types, featuring advanced automation, data storytelling, and contextual analytics functions.
The result: With Yellowfin ensures, users get the right data, at the right time, in the right context.
Frequently asked questions (FAQs)
What are the 3 layers of dashboards?
Dashboards have three layers: Data preparation, logic processing, and visual presentation. Together, they transform raw data into actionable insights.
What are dashboard components?
Key components include charts and graphs, KPIs, tables, filters, drill-downs, and text. These make dashboards interactive and effective for decision-making.
Can I use one dashboard type for all reporting?
A single dashboard may cover basic reporting, but different dashboard types suit different needs—real-time monitoring, long-term planning, or deep analysis.
What are the 4 types of BI users?
The four BI user groups are executives (strategic dashboards), analysts (analytical dashboards), operational teams (operational/project dashboards), and data engineers (back-end integration).
What is the difference between BI dashboards vs reports?
Dashboards provide a real-time, interactive snapshot of key metrics on a single screen, such as KPI dashboards for performance tracking or project dashboards for timelines and resource allocation. Reports are static, detailed documents of historical data (best for in-depth analysis). Learn more in our BI Dashboards vs Reports deep dive.
What are the main types of dashboards in business intelligence?
The most commonly used BI dashboards are operational, strategic, and analytical dashboards, each serving different decision-making needs. Yellowfin also adds two modern categories—contextual and tactical dashboards—which offer deeper insights and actionability. Understanding these dashboard types helps organizations choose the right tool for real-time monitoring, long-term strategy, or in-depth analysis.
What is the difference between operational, strategic, and analytical dashboards?
Operational dashboards track real-time activities and KPIs, strategic dashboards help executives review long-term goals, and analytical dashboards allow analysts to explore trends and patterns using historical data. The blog clearly explains that each dashboard type supports a different level of business decision-making, making it essential to match the dashboard to the user and the data need.
What is an operational dashboard used for?
An operational dashboard is designed for day-to-day performance monitoring, helping teams track KPIs, detect issues quickly, and keep operations running smoothly. Yellowfin’s examples show how these dashboards support sales tracking, customer support queues, supply chain monitoring, and inventory management—making them crucial for frontline managers.
What makes a strategic dashboard effective for executives?
A strategic dashboard brings together high-level KPIs over months or years, helping leadership evaluate company-wide performance and progress toward strategic goals. As described in the blog, strategic dashboards summarize large datasets into simple visuals so executives can make long-term, data-driven decisions with confidence.
What is an analytical dashboard and who uses it?
Analytical dashboards are used by analysts, data scientists, and decision-makers who need to explore complex datasets, identify patterns, compare segments, and make predictions. The blog highlights that these dashboards include drill-downs, filters, and even predictive analytics, allowing deep investigation into time, region, or product trends.
What is a contextual dashboard in BI?
A contextual dashboard embeds data directly into the application where users work, providing real-time insights alongside interactive, AI-powered actions. Yellowfin explains that contextual dashboards eliminate app switching by syncing with workflows and displaying personalized metrics, making decisions faster and more accurate inside CRM systems, management apps, or SaaS platforms.
What is a tactical dashboard and when should it be used?
A tactical dashboard is ideal for mid-level management who need to track progress toward departmental goals. It blends operational KPIs with project timelines and resource allocation, helping managers keep teams aligned with larger business objectives.
What qualities define a high-performing BI dashboard?
An effective dashboard should be clear, relevant, interactive, timely, and accessible. This means showing the right KPIs, updating data in real time, offering drill-down capabilities, and ensuring the dashboard is easy to use across platforms. These qualities ensure dashboards provide real business value rather than overwhelming users with unnecessary data.
How can I choose the right type of dashboard for my business?
Choosing the right dashboard depends on who will use it and what decisions they need to make. Aligning dashboard type to user roles is key: executives benefit from strategic dashboards, analysts prefer analytical dashboards, operational teams rely on real-time dashboards, and product teams often use contextual dashboards. Matching the dashboard to the user leads to better adoption and more impactful insights.
What are the best practices for designing a BI dashboard?
Best practices include defining your audience, focusing on meaningful KPIs, ensuring a clean visual layout, adding interactivity only where useful, and testing the dashboard with actual users. Yellowfin emphasizes that dashboard design should not just present data—it should guide users to take action, making clarity and usability essential.
Best dashboards for your BI use case?
Discover why Yellowfin BI is the best embedded analytics software solution for action-based, fully customizable and contextualized analytic dashboards.