

Contextual analytics vs dashboards: What's the difference?
From standalone dashboards to guided, dynamic insights, contextual analytics closes the last gaps and pains of traditional business intelligence. But how are they different?
For 20 years, standalone BI tools have failed to penetrate more than 25% of the average organization, with most workers using them once a week, according to Eckerson Group.
While many modern dashboards are sophisticated and user-friendly, they are still often accessed as standalone tools outside of line-of-business applications. This separation means it isn’t guaranteed that users will adopt BI, or gain insight from their data.
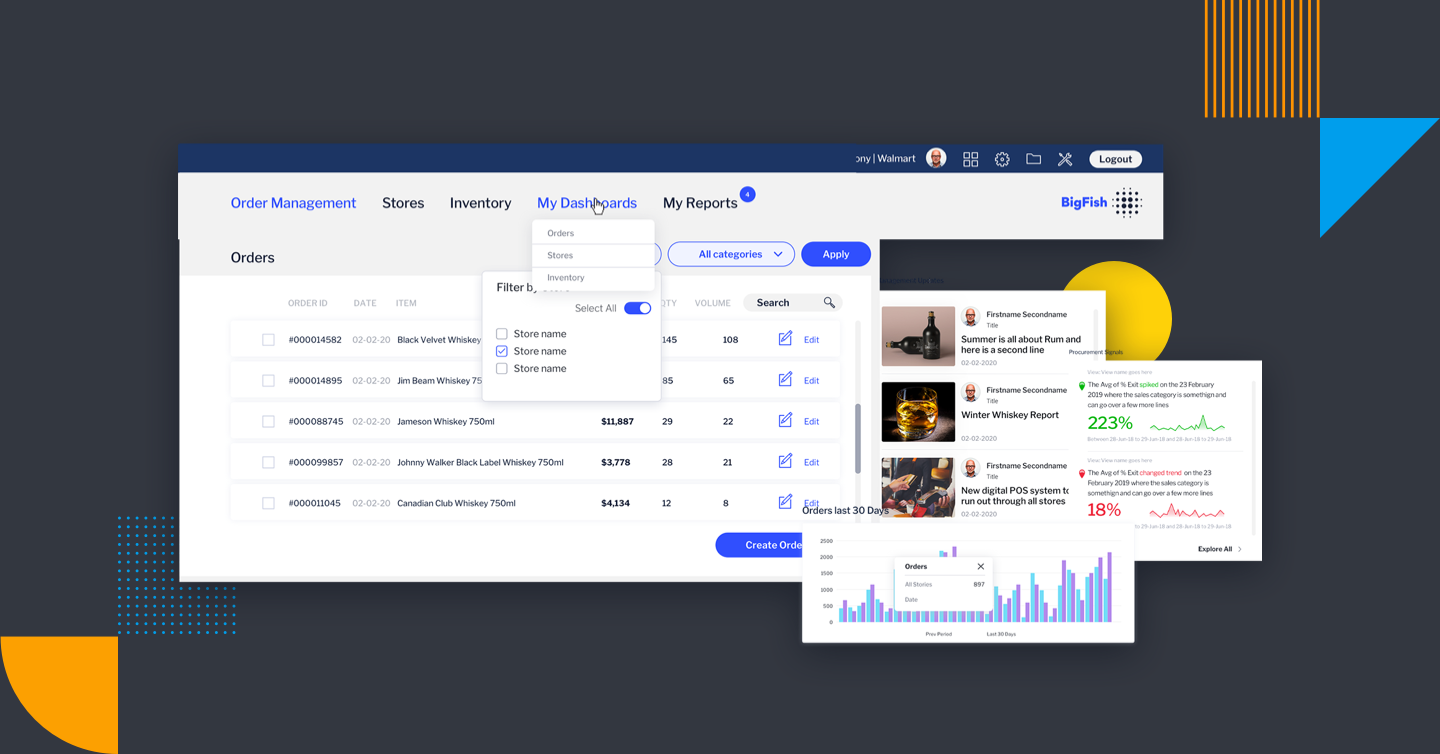
Embedded analytics solves this problem by inserting dashboards, charts, reporting and authoring environments directly inside your host application as dedicated modules. Analytics is made to look and act like your app, rather than an externally-accessed tool.
Today, contextual analytics is changing this equation even more dramatically with a deeper merger of analytics and transactions, introducing several major improvements. Here we explain the 3 biggest differences between dashboards and contextual analytics.
1. Flexibility vs Friction
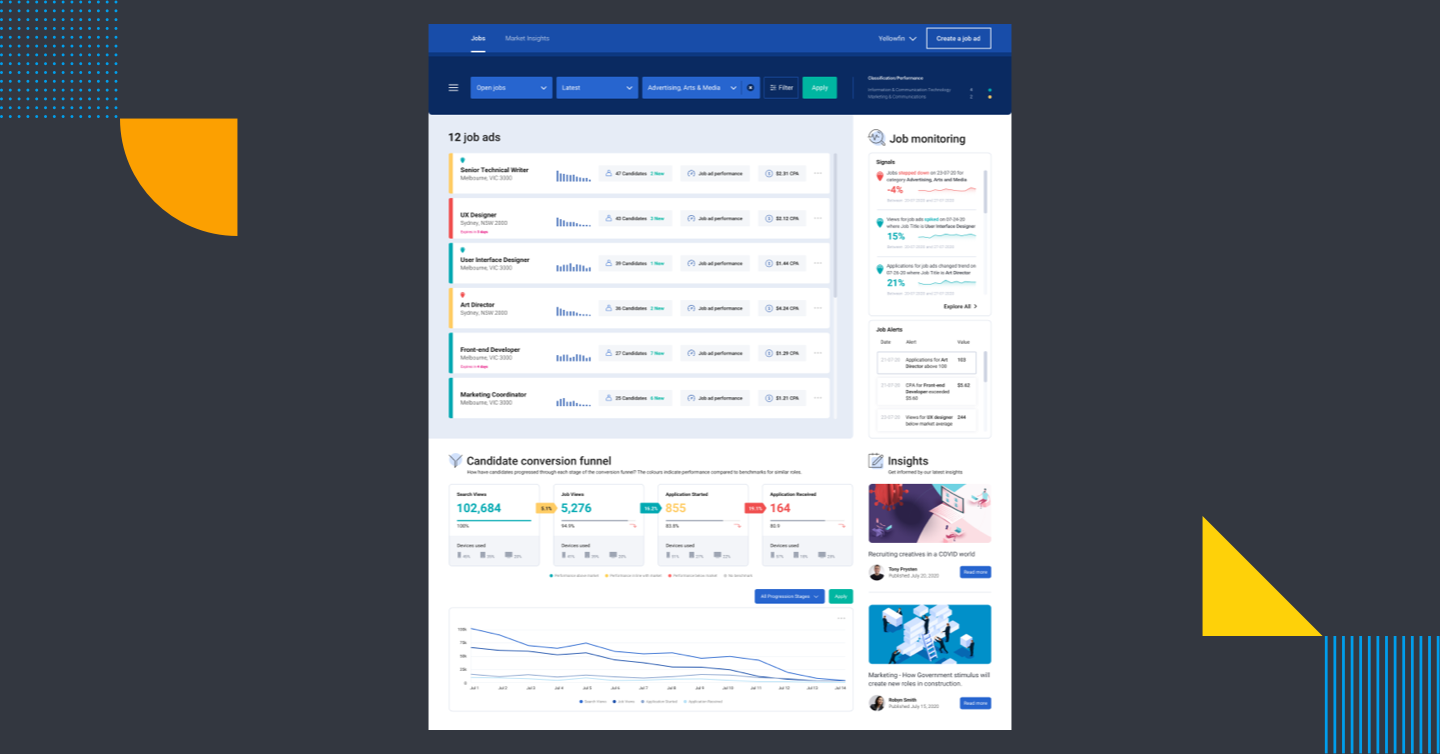
Contextual analytics brings the latest self-service BI tools (dashboards and reporting) and analytical capabilities (augmented analytics and automated business monitoring) directly into an application’s interface and core workflow. Alerts, charts, tables and visualizations sit side-by-side on the screen alongside the software’s central functions, and give users relevant data when they need it to assist in their next action.
With contextual analytics, users no longer have to switch away from their transactional environment (i.e. into another application or tab) for more context, as they have instant access to related information in the same user interface. The BI solution itself actively guides its users toward their next action, helping make analytics a seamless part of their daily workflow. When a user views an account record for a customer, for example, their purchase history dynamically pops up in chart format, helping them make a decision right then on further sales incentives.
In comparison, traditional standalone dashboards separate analytics from the application’s transactional environment. Users must stop where they are doing and switch applications to a dashboard to source their data when they need more context to validate decisions or to derive insight. This can disrupt the user’s thought process and create friction in their workflow efficiency and effectiveness.
Read More: 5 Reasons To Implement Contextual Analytics
2. Guidance vs guesswork
Artificial intelligence (AI), automated analytics, data storytelling and machine learning (ML) are significant components of contextual analytics. Together, they help create a sophisticated BI solution that proactively guides users toward how best to use the analytics tools available to them and where to find answers in their data. Contextual analytics also provides many powerful analytical capabilities, once only available to analysts or data scientists, to regular business users in a way that is user-friendly and that seamlessly blends into their usual systems and processes.
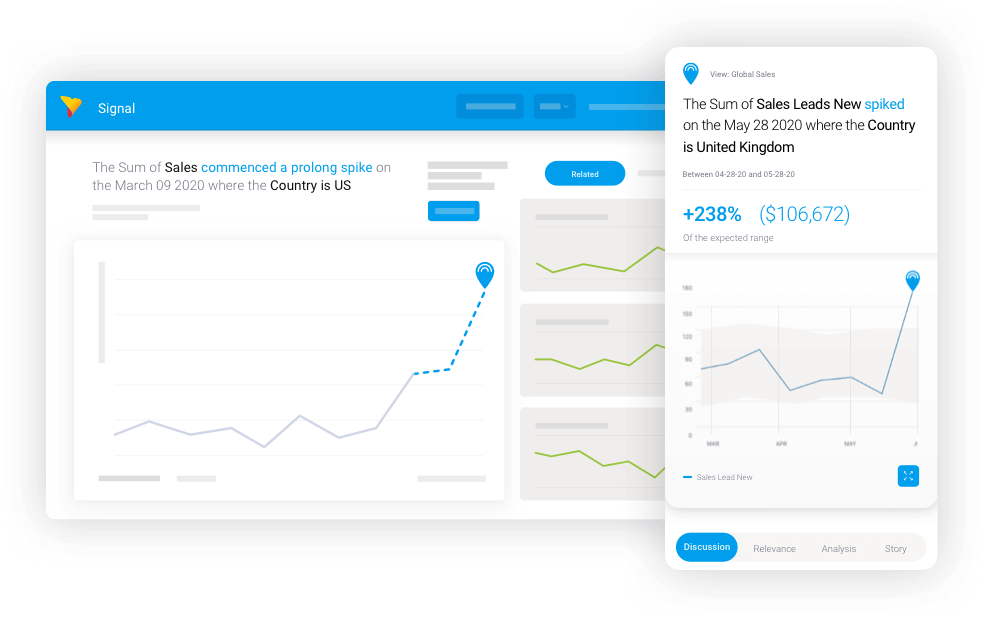
For example, contextual analytics platforms with features such as Yellowfin Assisted Insights and Signals proactively explain what the data users see on a dashboard means (using natural language) and notifies users of not just what changes have occurred but what they may mean in a broader context (automated alerting). The point of having these tools is to ensure users don’t resort to making decisions based on gut-feeling, as they now have intuitive systems in their workflow that explains the meaning behind their data.
In comparison, standalone dashboards are a great way to display a high-level overview of the most important information in specific business areas, with many ways to splice, dice and drill down into the details if necessary. But unless the user is already well-versed with their BI solution, they may not know the best ways to explore or use the data presented to them. As dashboards are commonly separate from operational processes, it can also create more unnecessary hurdles for people to use their available BI tools. This can lead to users making decisions based on intuition instead of data resulting in unreliable - and completely avoidable - guesswork.
3. Engagement vs disconnection
Because it’s integrated into line-of-business applications in a way that is indistinguishable from the main experience, contextual analytics ensures more people will gain value from their BI. Placing analytics right in front of users as they work in a streamlined, seamless way engages them to use their dashboards and other BI capabilities consistently, as analytics is no longer a standalone tool, and the product itself integrates it as a core function rather than a separate tab.
Standalone dashboard tools are still incredibly useful for self-service analysis. However, user engagement with BI is entirely reliant on the individual user and whether they go the extra mile to consistently switch from their main work application to their dashboards when they need more information. It’s a disconnect from their workflow and a roadblock to keeping them in your app - which contextual analytics negates.
Is contextual analytics replacing dashboards?
It’s important to emphasize that modern dashboard-based analytics are still very useful self-service BI tools. They provide great summaries of critical information that can be viewed, monitored and actioned at-a-glance. But many modern organizations have increased needs for insights, and there’s a growing awareness that dashboards are no longer the only or main source of information business users have to rely on to inform their decision-making anymore.
This is the key role that modern BI capabilities, such as contextual analytics, fulfills. Dashboards still have their place in BI, but there are newer features that serve to enhance their potential.
Free Whitepaper: What is Contextual Analytics? The Next Level of Embedded BI
Embedded analytics brings dashboards into our enterprise applications - but they're still integrated and used as separate modules to your core software. What if there was a better way to bring analytics closer to your app users?