

9 Key Features of Enterprise Data Visualization Software
Enterprise organizations with complex datasets, need to find ways to make their data more accessible and usable. One way to do this is through data visualization, which can help provide reporting that makes data more understandable and actionable.
While the bare minimum requirement for data visualization BI software is good data visualization capability, there are more specific features that are often needed. If done right, data visualization tools can help improve understanding of information, enable faster decision making, and reduce the time needed to produce valuable insights.
Let's take a look at nine key features of enterprise data visualization software, and see how they can help your organization.
What are the Problems Enterprise Data Visualization Address?
Data discovery, mining, and understanding are often the main goals of the best data visualization tools. They can help users quickly find insights in large datasets, and make it easier to understand complex relationships.
The problem is, in-house data scientists and analysts often have different goals, requirements and answers for the recurring question: What is data visualization?
Based on their own individual understanding of the concept and unique business requirements, some teams want reports that are easy to understand, while others want interactive dashboards that allow them to explore datasets in more detail.
Existing tools often don't cater to the needs of different users, however, and it can be difficult to find the right tool for the job that can be tailored to diverse requirements. This can lead to frustration and wasted time, and under-adoption of self-service BI altogether.
So, what is required from an enterprise data viz solution?
BI software with visualization capabilities first need to be able to understand the data sources and structures that it is working with. Data sources can be a variety of different types of data, including text, tables, graphs, and images. The structures can include individual records, groups of records, or entire databases. The best data visualization tool will also be easy to use and offer extensive customization options for charts and graphs.
A Power BI report can show you how customers are interacting with your product, and how changes in your product's design are affecting customer behavior, but often lacks customizability and accessibility for the average user.
Other features required that make visualization easy to use include a drag and drop interface, and tabular data that can be displayed in charts and graphs, making it easy to see patterns and trends. An interactive visualization can help analysts explore datasets in more detail, for example, but if the charts are too difficult for non-experts to use, it's less likely that anyone will be able to use it.
Data visualization tools should also help you find patterns and insights in your reports that you might not have otherwise noticed. By visualizing your operational metrics in a way that is easy to understand, this helps everyone make better decisions based on the figures - not just gut feeling.
The best data visualization tools, like Yellowfin, incorporate many features that make it easy to find the information you're looking for, and to get insights that you need.
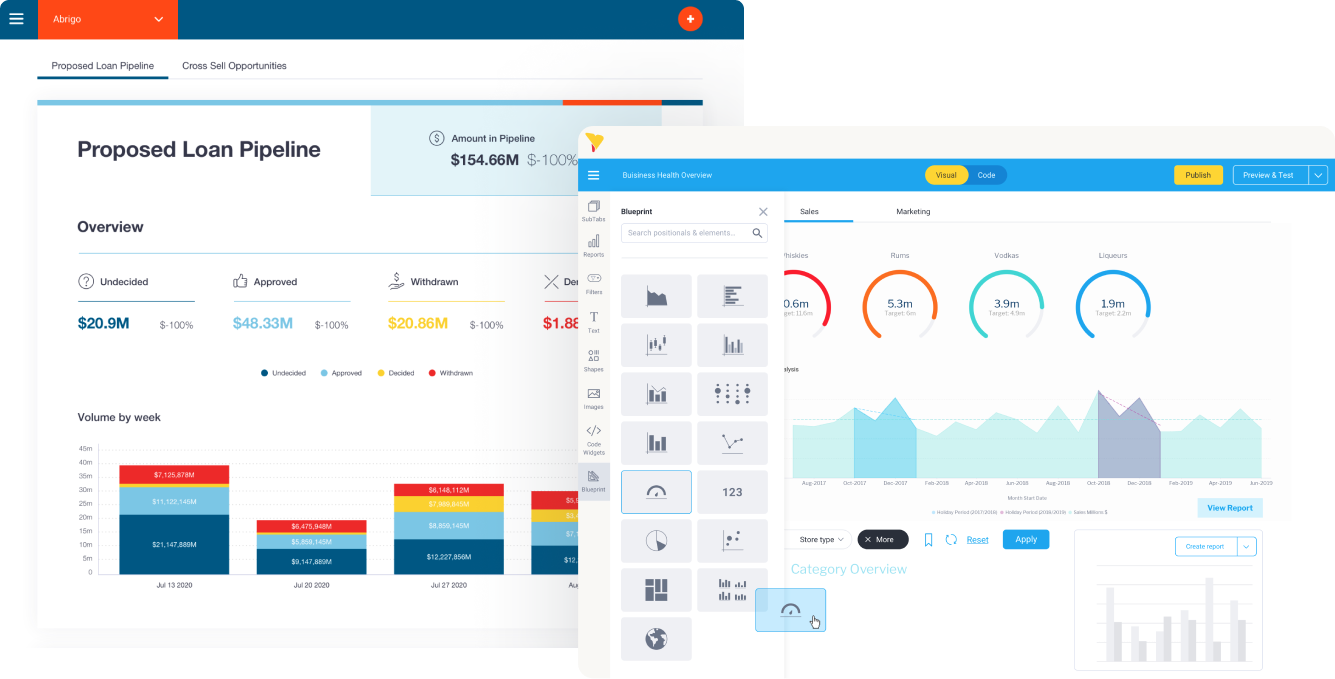
Data sources can be filtered and sorted, so you can find the information you're looking for quickly. Data visualizations can also be embedded in websites and applications, so users can access them from anywhere. With Yellowfin's drag and drop capabilities, you can also quickly create custom reports that are tailored to your needs - see for yourself below.
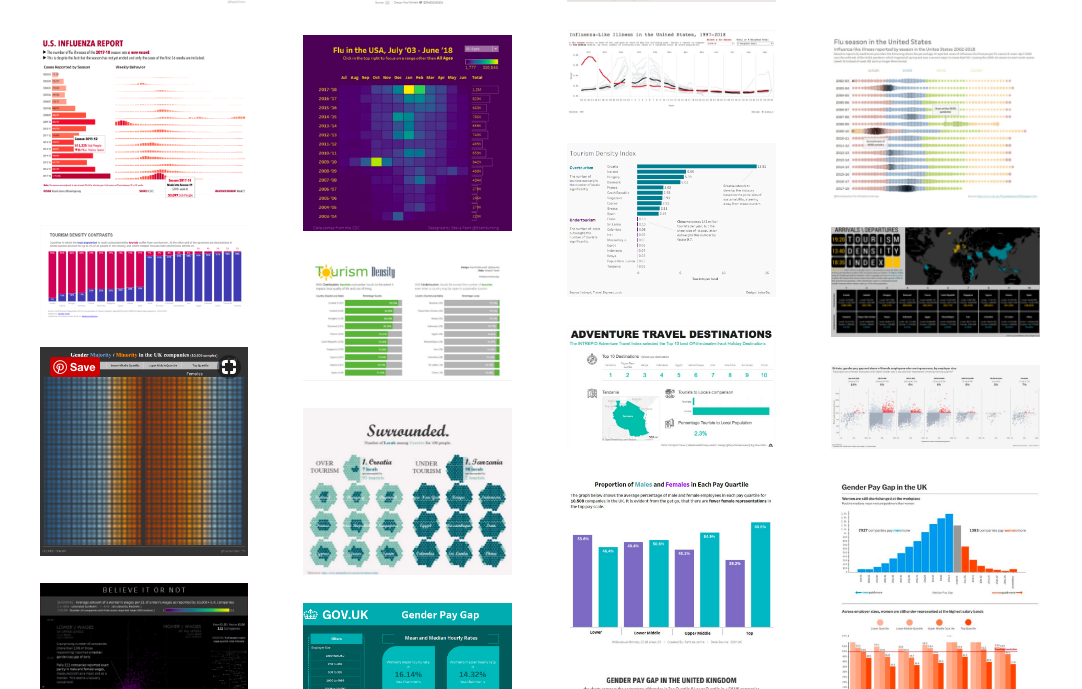
See more: Yellowfin Interactive Data Visualization and Dashboard Gallery
What Are the Nine Key Features of Enterprise Data Visualization Solutions?
Below, we cover 9 key features of enterprise data visualizations that you must have when looking to adopt a new analytics solution in your business or application experience.
1. Embeddability
In-house data visualization can be a powerful tool for improving understanding and decision making. However, it can be difficult to get started without the right tools.
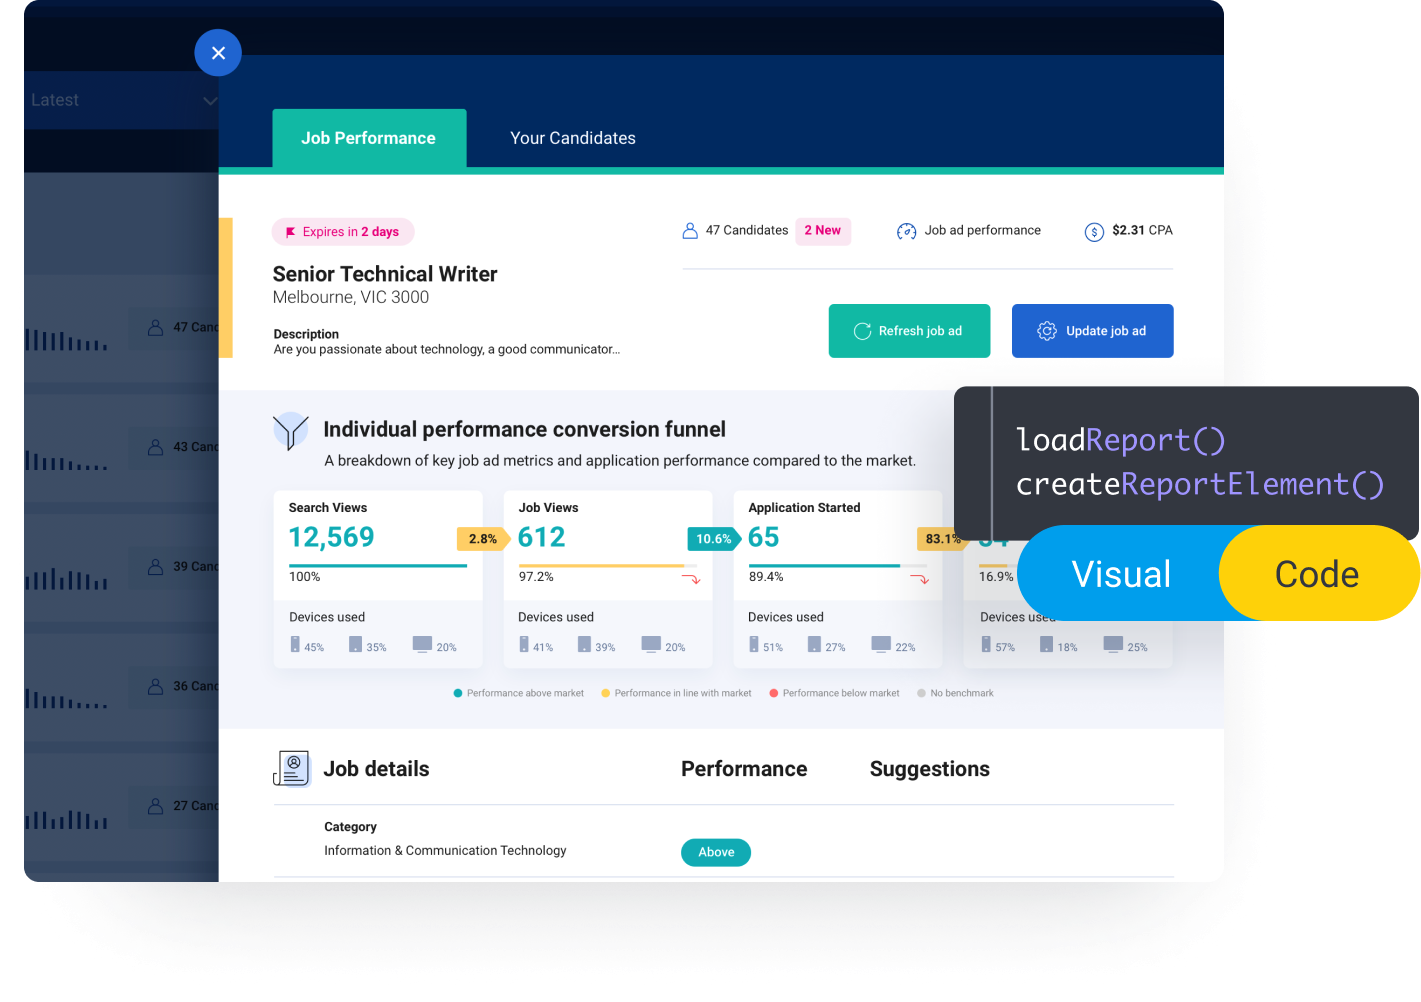
A good enterprise data visualization analytics solution should be embeddable, which means that it can be embedded into other applications and websites - also known as embedded data visualization tools. This makes it easy to share visualized information (charts, maps) with other team members, and to use as part of larger analysis efforts.
2. Performance
A powerful BI and analytics tool is no good if it takes too long to generate reports and dashboards and graphically represent them. A good analytics tool should be fast and responsive, so users can get their analysis done quickly.
3. Chart and Graph Customization
The complexity of diversity of datasets can make it difficult to find trends and patterns in graphs and charts. The enterprise solution you adopt should allow users to create interactive visualizations and then customize graphs, charts and maps to make them more effective at conveying key business information.
This allows end-users to create interactive graphs and charting that are tailored to their specific needs and the needs of their audiences, as well as leverage a wide array of chart types (bar charts, pie charts, scatter plots) to visualize key metrics.
4. Interactive Exploration
While interactive charts are a powerful visual capability, they can also be overwhelming.
A good enterprise visualization analytics product should make it easy for users to explore the information graphically represented in a way that is both informative and intuitive. This means that they can quickly find the answers they are looking for, without having to sift through a lot of information.
5. AI, Machine Learning, and NLQ Integration
Data visualization capabilities are often enhanced by a number of other big data and analytics features depending on the business intelligence solution being used. A common integration is the use of AI or machine learning algorithms, which can help make information more understandable and useful, and automatically learn from the metrics and improve the accuracy of results over time.
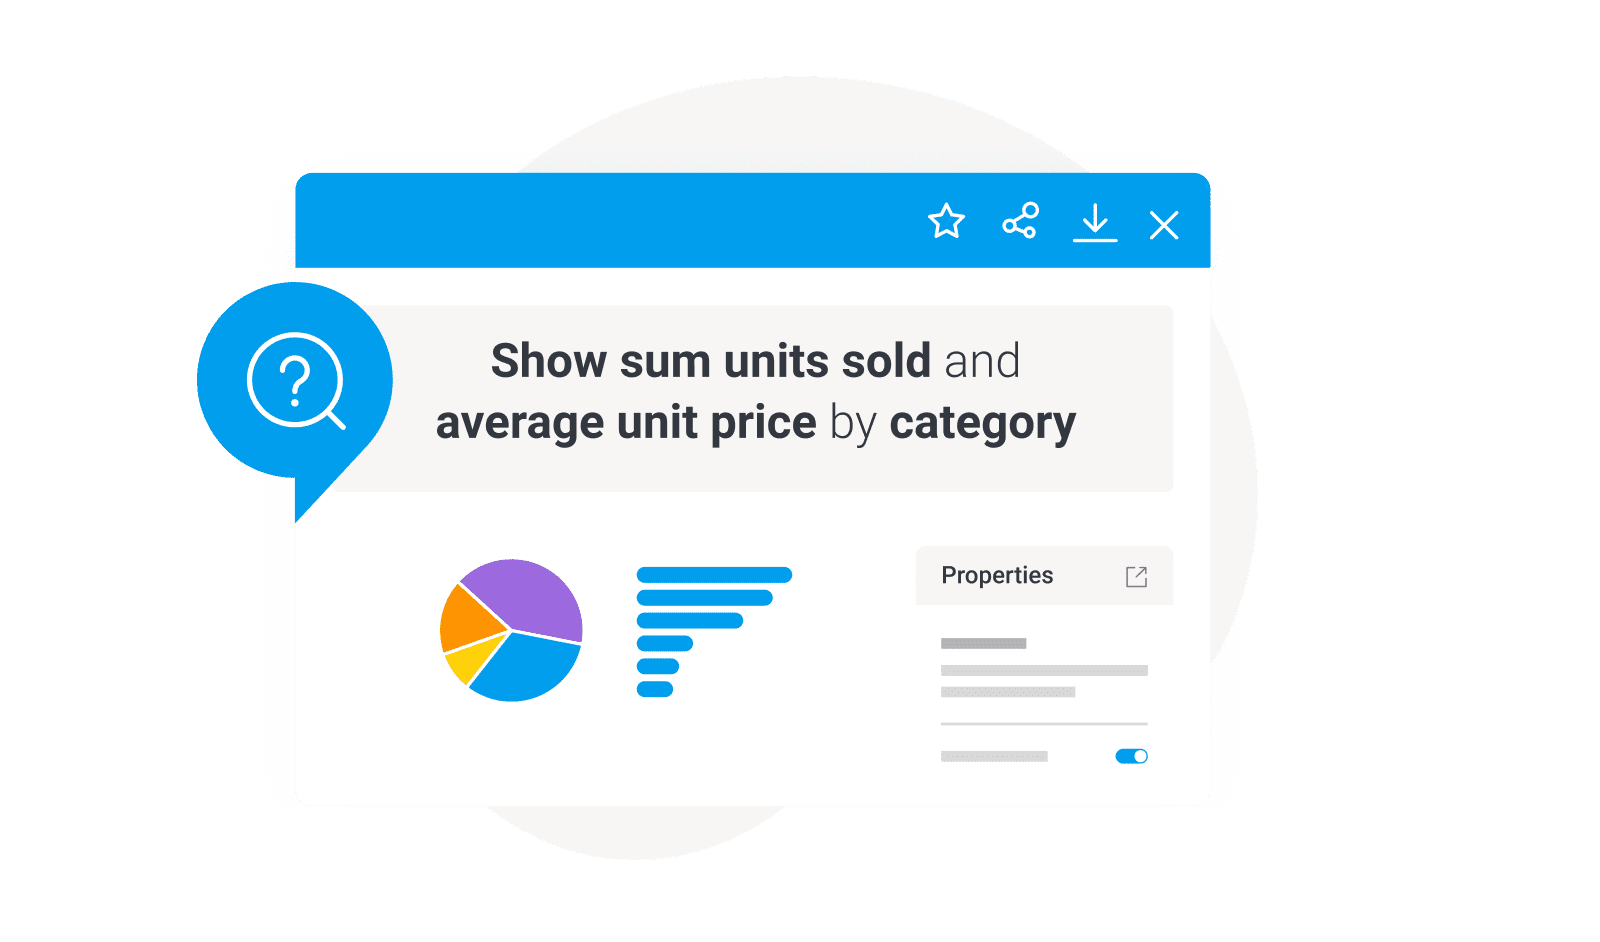
Natural language query (NLQ) is one such important analytics feature that enhance visual tools. NLQ can help make BI reporting more accessible and usable by understanding the context in which it is being used, and delivering a best practice data visualization to the end-user querying their datasets. This can help make metrics more actionable and help users get the most out of the variety of visualization generated.
6. Metadata Management
A core feature in enterprise business intelligence solutions often overlooked is metadata management. This includes the ability to manage data sources, data formats, and other information about the data.
This can help ensure that the data is correctly represented in dashboards, and that it is easy to find and use. Examples of solutions that have meta-data management include Yellowfin, Microsoft Power BI and Tableau.
7. Self Service Capability
Data analytics is a time-consuming process, and often requires the input of multiple team members. Data visualization tools should make it easy for individuals to create their own reports, without having to rely on IT or analyst experts.
You may create visualizations, types of charts or embed charts that are specific to your organization's needs, or that can be shared with other team members. This self-service capability is important because it allows individuals to work on analysis in their own time, and without having to wait for someone else to finish.
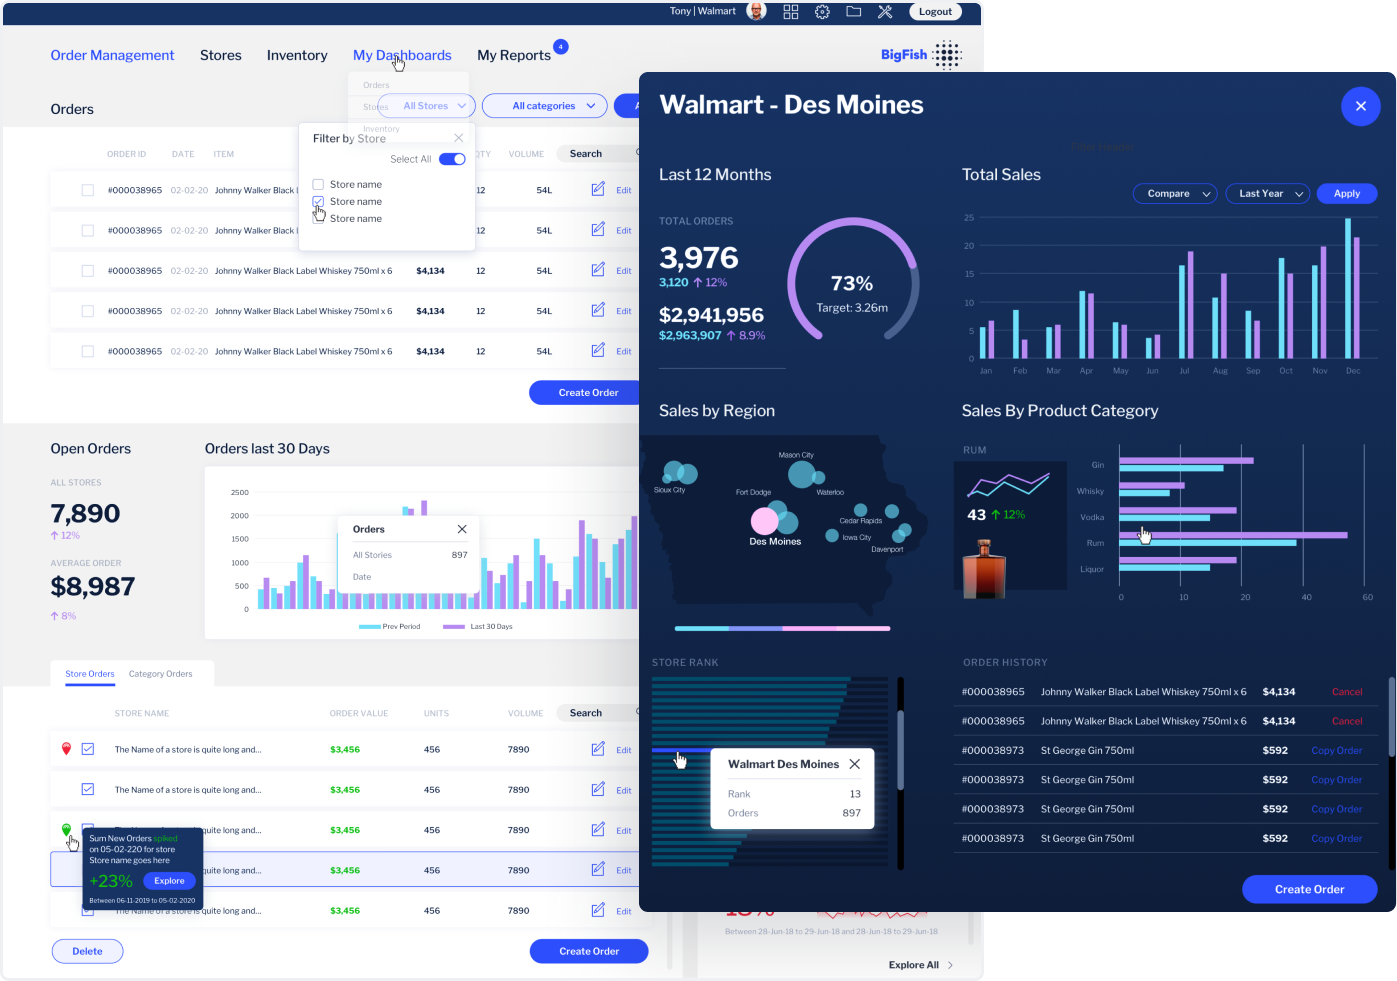
8. Geo Tagging and Location Intelligence
Being able to graphically represent data in charts and graphs is a powerful tool to have, but it can be difficult to use if the figures are not properly tagged. Data that is geo-tagged can help users see how different parts of the world are related, and can help them make better decisions.
Location intelligence can also help users find specific data points, and can help them understand how different regions are performing. This information can be used to improve business operations, or to make better decisions about where to invest resources.
9. Data Discovery
Visualizing data can help organizations find insights that they would otherwise miss. Data discovery is the process of uncovering patterns and relationships in data that were not previously visible.
Data discovery can be done through a variety of methods, including filtering, sorting, and grouping data. It can also be done through the use of interactive visualization tools, which allow users to explore data in a more intuitive way.
Need An Extensive, Customizable Data Visualization Solution?
With so many visualization tools available, it can be hard to decide which one is right for your organization. The best data visualization tool will provide the features you need and the flexibility to meet your specific needs.
The best data visualization tool will also be easy to use and provide a high level of customization. You will be able to create reports and dashboards that are exactly what you need, without having to spend hours tweaking the settings.
Interactive reports, graphs and dashboards are just a few of the features that are available in Yellowfin's enterprise data visualization tools. Our analytics platform provides the ability to create powerful data visualizations quickly and easily, giving you the insights you need to make informed decisions.
Frequently Asked Questions About Enterprise Data Visualization Software
What Is Enterprise Data Visualization Software?
Enterprise data visualization software helps large organizations analyze and present complex data using interactive dashboards, charts, and reports. It is designed to handle high data volumes, multiple users, and advanced analytics requirements.
How Is Enterprise Data Visualization Different From Traditional BI Tools?
Enterprise data visualization focuses on real-time insights, self-service analytics, and embedded dashboards, while traditional BI tools rely more on static reports and analyst-driven workflows.
Why Do Large Enterprises Need Data Visualization Software?
Enterprises use data visualization software to simplify complex datasets, improve decision-making speed, and ensure data is accessible to both technical and non-technical users across departments.
What Are the Must-Have Features of Enterprise Data Visualization Software?
Key features include embedded analytics, high performance, interactive dashboards, AI-driven insights, self-service BI, metadata management, and scalable architecture.
What Is Embedded Data Visualization and Why Is It Important for Enterprises?
Embedded data visualization allows dashboards and reports to be integrated directly into business applications, improving user adoption and enabling data-driven decisions within existing workflows.
Can Non-Technical Users Use Enterprise Data Visualization Tools?
Yes. Modern enterprise data visualization tools are built for self-service BI, allowing non-technical users to create, explore, and customize dashboards without relying on IT teams.
How Does AI Improve Enterprise Data Visualization and Analytics?
AI enhances enterprise data visualization by automatically detecting patterns, surfacing insights, recommending visualizations, and enabling natural language queries for faster analysis.
What Is Self-Service BI and Why Does It Matter in Enterprise Analytics?
Self-service BI empowers users to generate their own reports and dashboards, reducing dependency on analysts and accelerating insight generation across the organization.
How Does Enterprise Data Visualization Support Real-Time Decision Making?
By visualizing real-time and near-real-time data, enterprise data visualization software enables organizations to monitor KPIs, respond quickly to changes, and optimize operations.
How Do Enterprise Data Visualization Tools Help With Data Discovery?
Enterprise data visualization tools support data discovery by enabling interactive exploration, filtering, and drill-down analysis, helping users uncover hidden trends and insights.