

How To Define a View and Create Reports using Yellowfin View
In the previous blog, the Yellowfin Japan team used Yellowfin's Data Transformation Flow feature to create a database of the CSV file of order history data. In this article, the team will demonstrate how to leverage the database for analysis by processing and formatting said data using native Yellowfin features, including View and Report Builder.
Note: Throughout this series, field names will be written in [square brackets], Yellowfin settings and selections will be written in "double quotations", and parameters that must be entered manually will be written in enclosing lines and shadings. No specific rules are defined for (rounded brackets) or ‘single quotations’, so please read them as normal punctuation marks.
With that, let's get into it!
Creating Reports and Defining Views in Yellowfin: An Overview
First, the Yellowfin Japan team will use Yellowfin View to prepare our data, catalogued in the previous article, for data analysis. The data we will be using only has one table, so the type of view to be created could be a Single Table, but since there are various things we would like to prepare, we will select Multiple Tables to create a view. In the Model step, we usually join a transaction table such as invoiced amount with a master table such as a product master, but as mentioned above, we will only be using one ORDER table, so after adding the table to the canvas and selecting all columns, we will proceed to the Prepare step.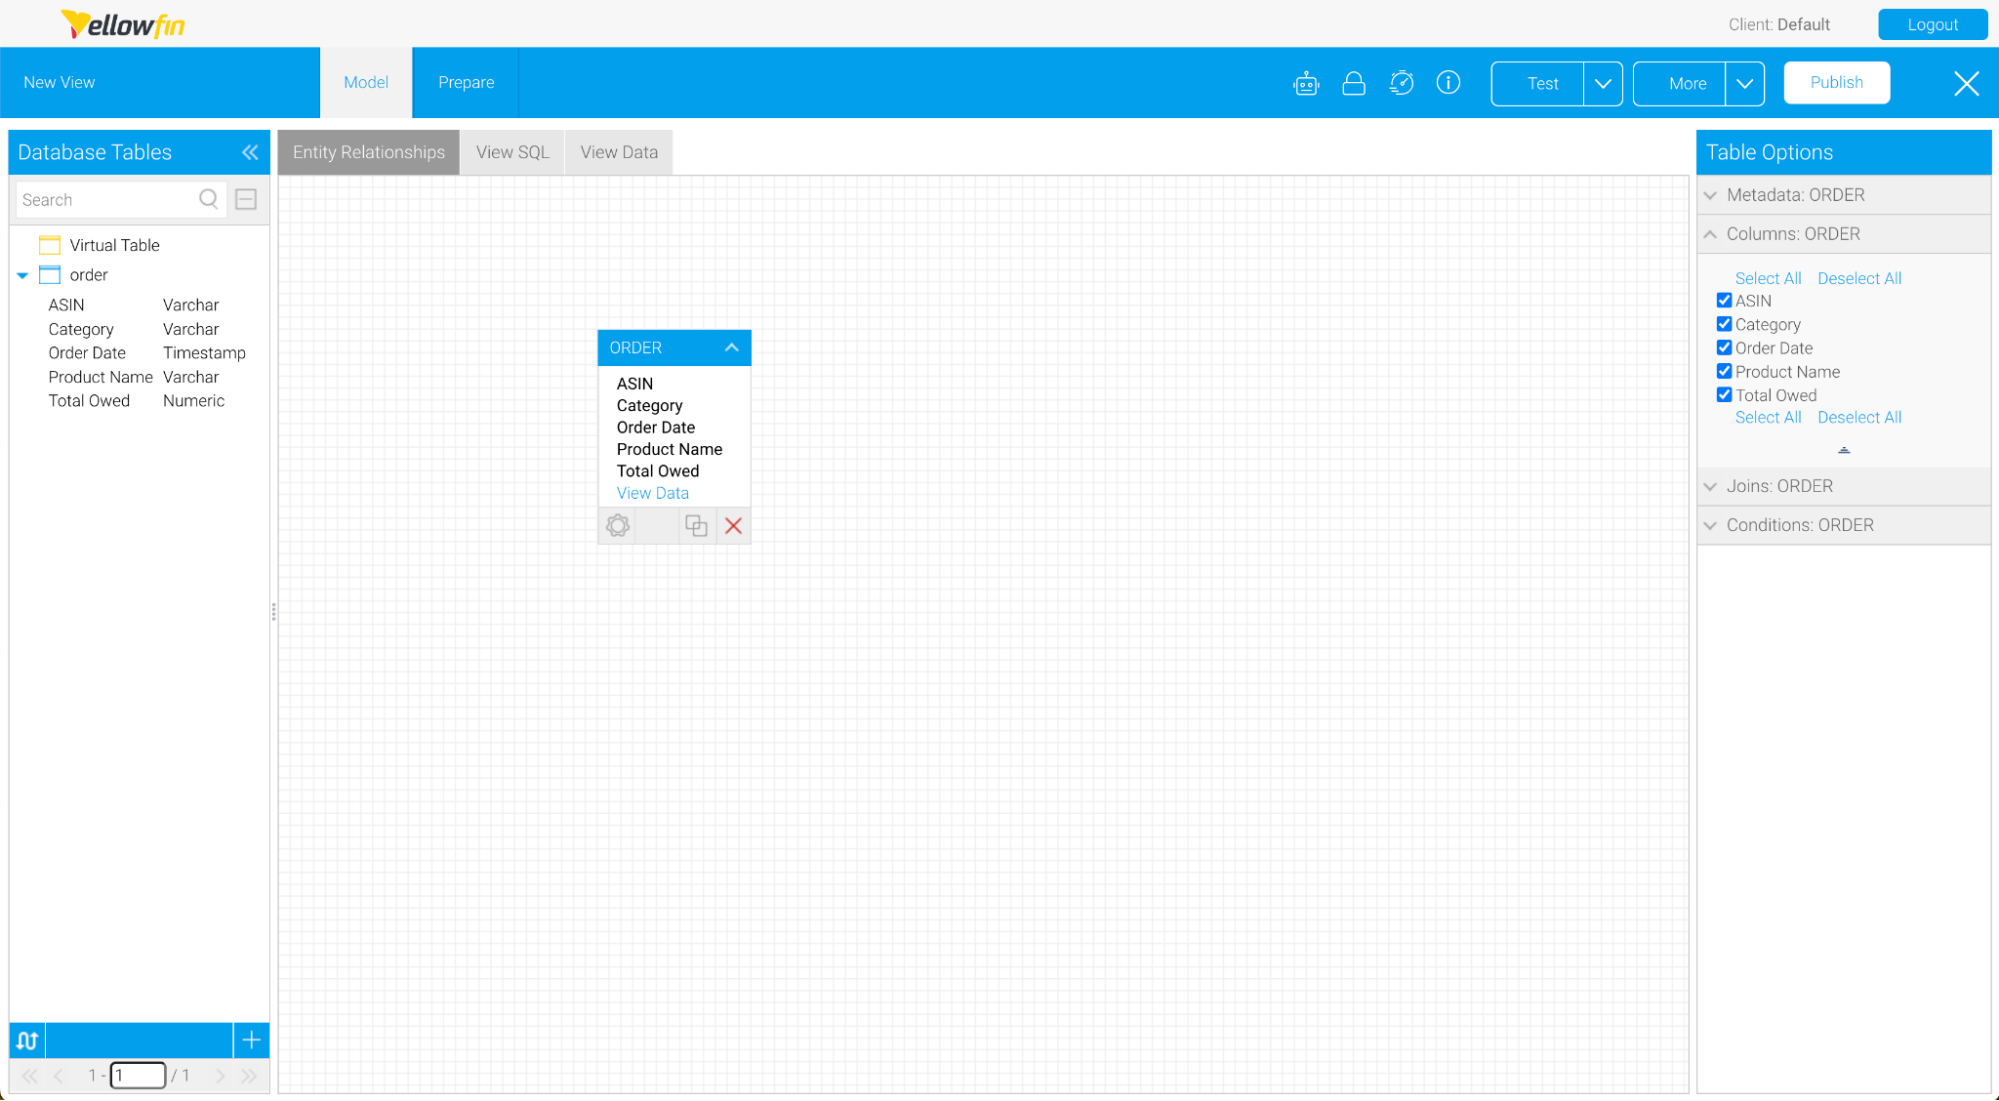 The Model Step defines relationships (join conditions) between tables, but we will skip them this time.
Creating date data with the Date Function
Create Year, Month, Date, Day of week, and Time data from the timestamp data. This is used to aggregate date/time level statements by year, month, or date, or to analyze by day of the week or time of day. We could have created those items in the previous blog using the Yellowfin Transformation Flow, but we missed it, so we will use the View Date Function to create them. Create "Date Function" for "Year Start Date," "Month Start Date," "Date," "Day of Week," and "Hour" for [Order Date].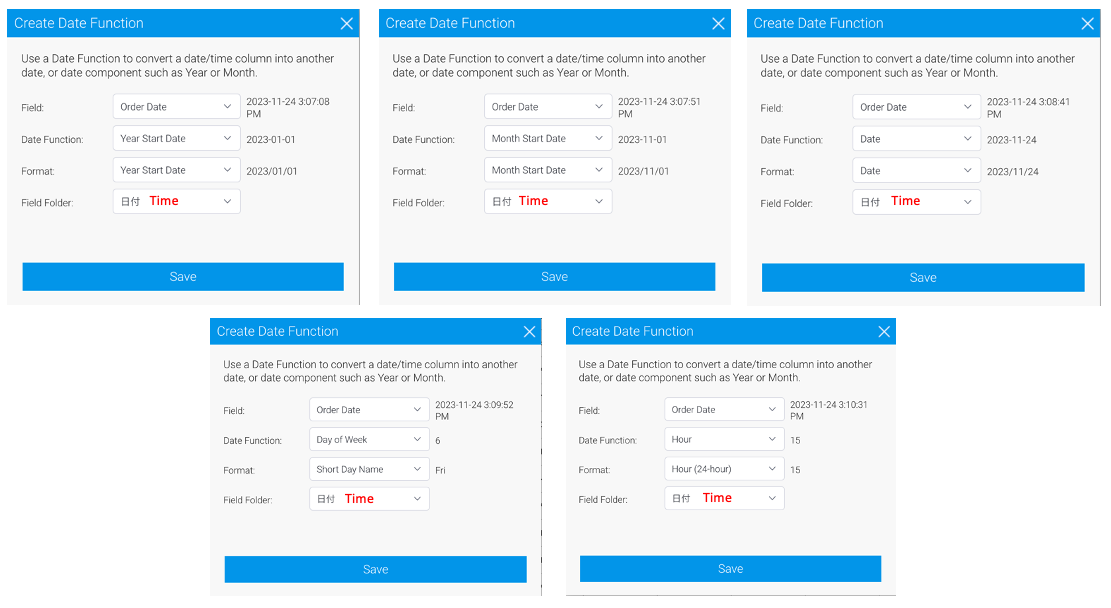 For reference, here is a list of Date Function settings to be created.
Changing the display name of the fields
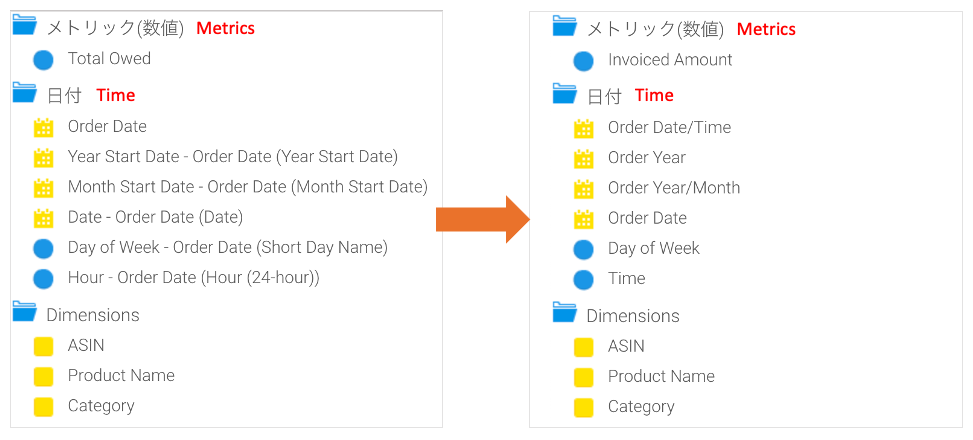
Once you have created the Date Function, it's time to change the display name of the fields. Many people don't do this because they think it's too much hassle, but it's sometimes hard to understand if you don't change the display name, so it’s better to change them at this stage of report creation. Below, we show you how to do so.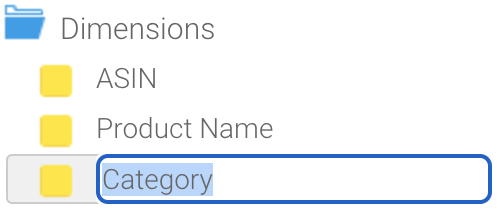 Simply double-click on the field name to change the display name. The result of changing the display name of all fields is shown below. It is obvious that the right side is definitely easier to consume than the left side, especially date fields.
Setting a Drill Hierarchy
The Drill Down Hierarchy can be set on the View Prepare Step. For this guided example, we can create a hierarchy of [Order Year] > [Order Year/Month] > [Order Date]. We could also create a hierarchy of [Category] > [Product Name], but in this case, the number of products per category is too large to be practical, so we will create a Drill Down Hierarchy of only [Order Year] > [Order Year/Month] > [Order Date].Changing the order of fields
Now it is time to organize the fields by changing the order of them. It is good to rearrange the fields while imagining the situation in which you create a report. Think about the order in which you can easily find the fields you want to use. For example, place the fields that are likely to be used frequently at the top of the folder, or place related fields near each other. If you have a large number of fields, another way to organize them is by adding Field Folders, as demonstrated in the screenshot below.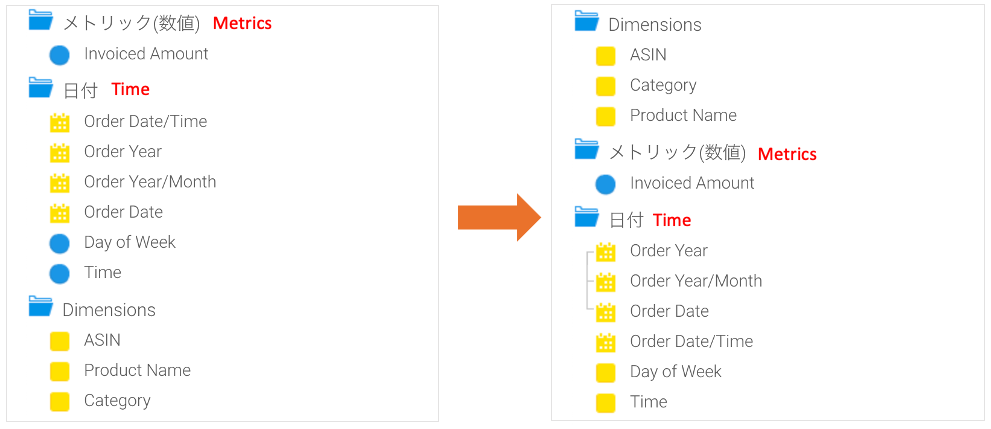
Setting the field formats
In the Field Formats, one thing you will always need to set when dealing with monetary values is to set the number of “decimal places" in the metrics to 0. The default value for the decimal places of a metric in Yellowfin is 2. This is due to the fact that in many countries, transactions are made in the subsidiary unit of the respective currency (e.g. cents for dollars). The “Field type” for the [Day of week] and [Time] is set to metric, so change this to “Dimension”. It is better to unify the field type of the value to be aggregated to Metric and the field type of the axis of aggregation to Dimension. By the way, do you know why the field for the Day of Week is in Metric, with the strings Monday, Tuesday, and so on? The Day of Week in the Date Function is a function that returns a day number from 1 to 7 (numerical value) from the timestamp data, so it is treated as metrics in the data. It is just that the formatting is set to display the numbers 1 through 7 for each day of week. We will also change the format of the other Date fields. For the [Order Year] and [Order Year/Month] fields, set “Date Format” to “Other” and set “Custom Date Format”. Set [Order Year] to “yyyy” and [Order Year/Month] to “yyyy/MM”. For the [Order Date] field, set the Date Format to “yyyy/MM/dd”. While setting the Date Format, it is also good to set the "Chart Granularity" as well. In the [Order Date/Time] field, set the "Time Format" to "H:mm:ss" and "Chart Granularity" to "Millisecond”.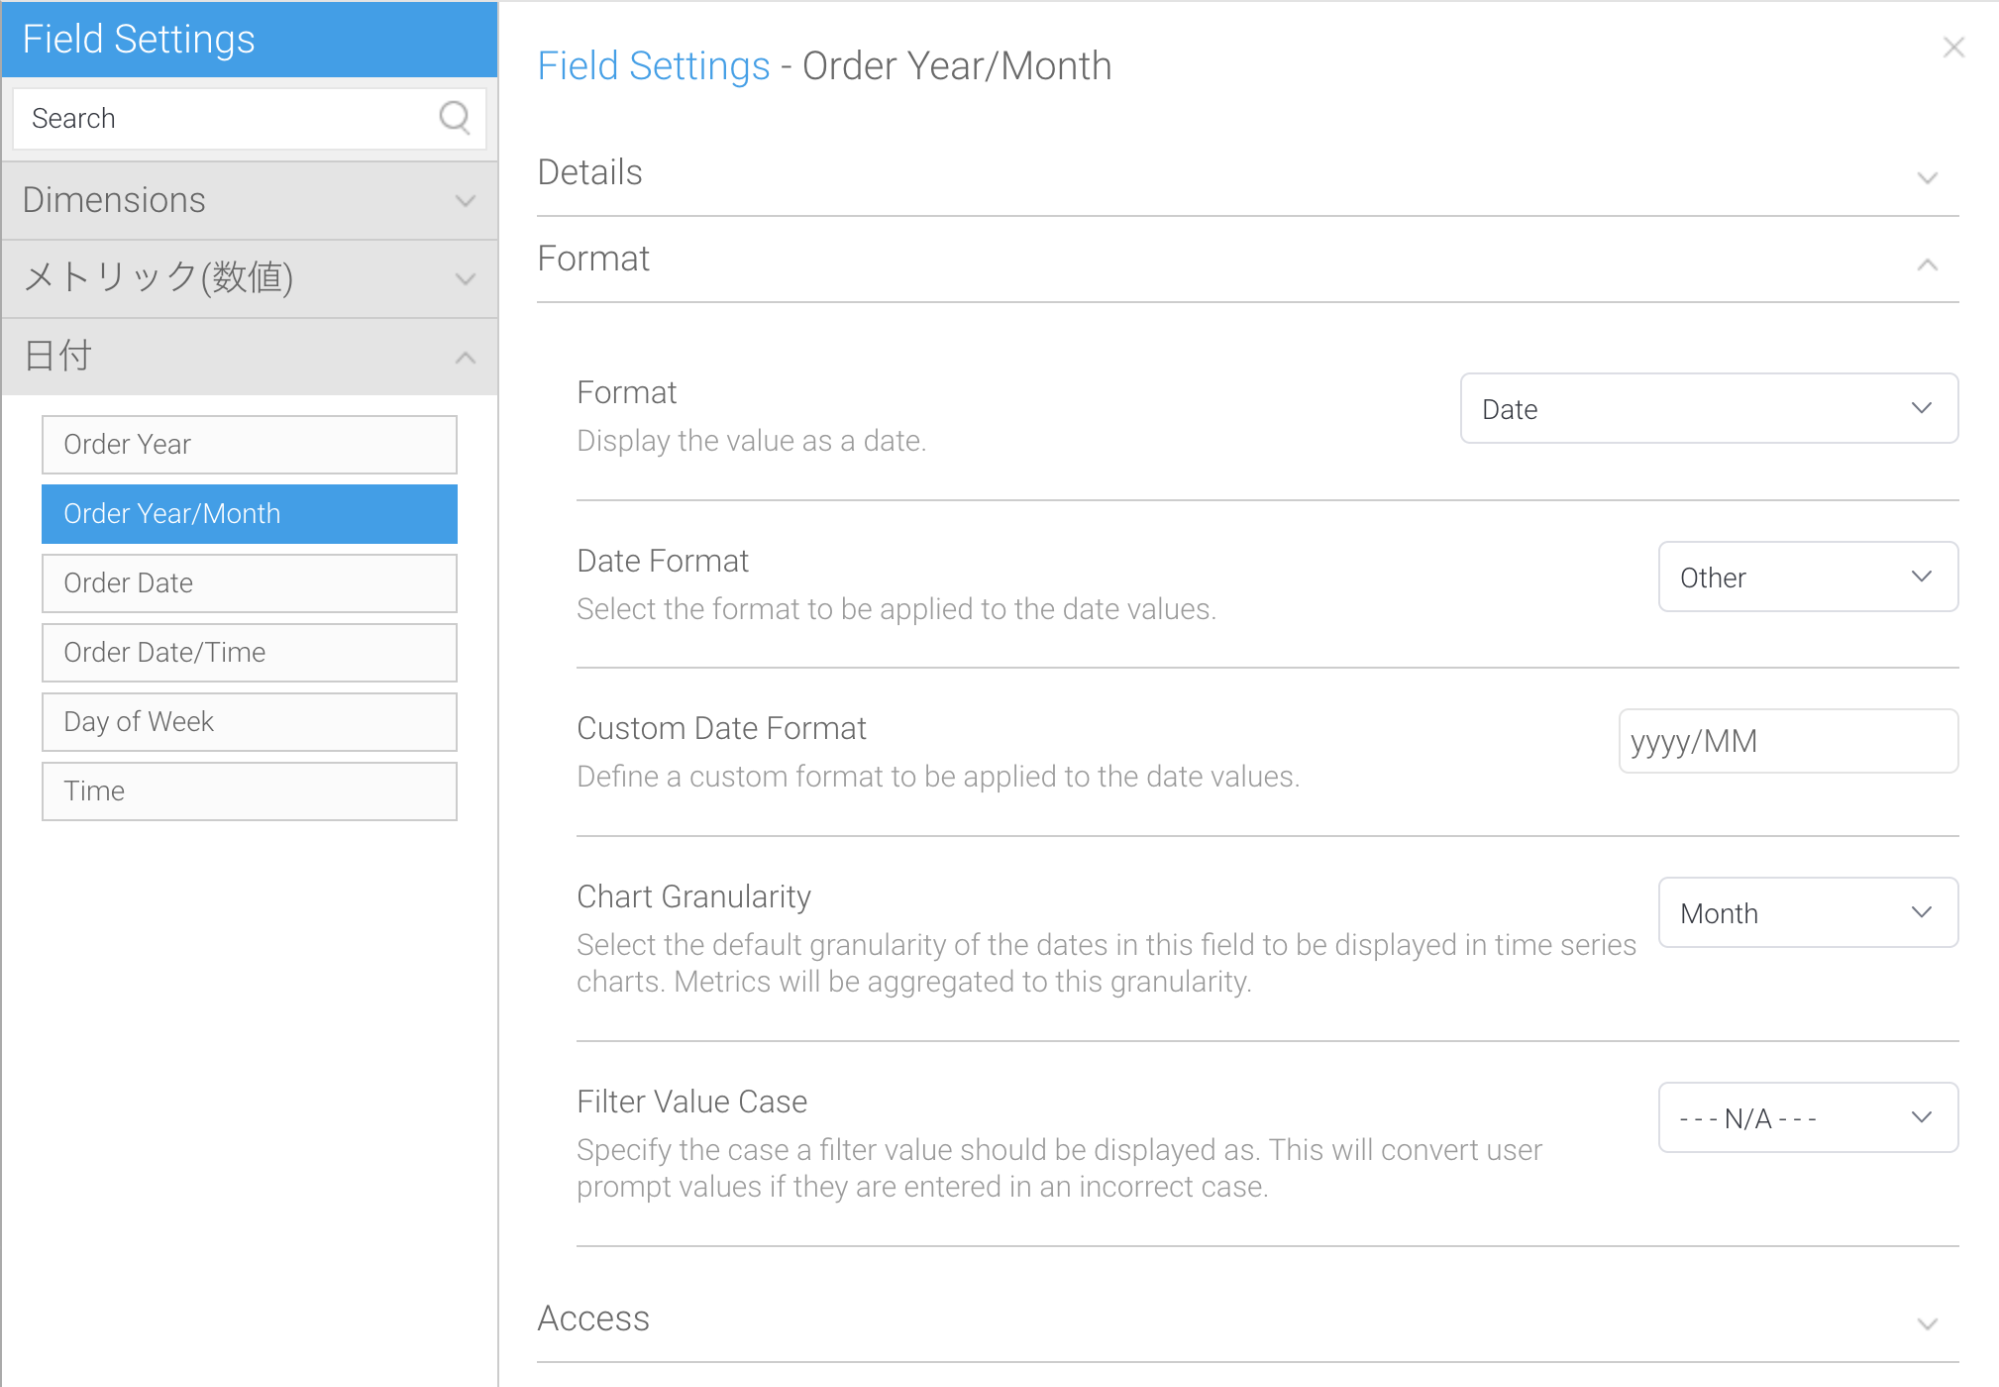 At this point, the view is now ready. Click the Publish button to save it.
In the next blog, we will finally create reports. We will have a series of four blogs, one for each report to be created, so please look forward to them!
At this point, the view is now ready. Click the Publish button to save it.
In the next blog, we will finally create reports. We will have a series of four blogs, one for each report to be created, so please look forward to them!