How Yellowfin Self Service Analytics Helps Automate Data Insights
For our regular readers at Yellowfin, the role of self-service analytics in today’s organization is more than clear. This type of analytics is aimed at helping more people across the company access, analyze and understand their business data, so they can make data-led decisions.
Self-service BI comes in many shapes and forms depending on the analytics vendor, but typically involves a combination of visual-based drag-and-drop user interfaces (UI), flexible data connectivity, and the implementation of automation to further simplify the user experience. Automation, in particular, is a huge part of Yellowfin’s self service analytics focus, as it further streamlines the process of querying data and finding insights for non-technical business people.
In this blog, we cover 3 key self-service features of the Yellowfin BI software suite that helps automate insight delivery, so you can better achieve a modern self service BI experience for all across the organization: Assisted Insights, Signals and Broadcast.
1. Assisted Insights
For many analytics users, monitoring business data isn’t the challenge - it’s understanding what caused the results. Not every person has the time, or knowledge to be able to dig into their data to pinpoint how or why a particular trend or pattern has occurred, meaning one of two things - the user has to go find help from a data analyst, or the specific insight they seek is left unanswered. Assisted Insights is a data discovery feature exclusive to Yellowfin that lets analytics users leverage automation, machine learning (ML) and natural language generation (NLG) to help explain or compare the results of their data for them, lessening the need to go to an expert.
Example 1. Yellowfin Assisted Insights, or Auto-Analysis
In any dashboard or report within Yellowfin, a user can run the Assisted Insights feature by right-clicking an element (visualization, table or metric) and selecting either ‘compare’ or ‘explain' to provide detailed answers of a particular data-point. Assisted Insights finds the data to analyze and then runs the dataset through a series of steps to find the most statistically relevant results. It then automatically generates answers in the form of best practice charts and visualized narratives in natural language (non-technical, easy-to-understand explanations) within the same interface, providing users with deeper detail into the what, how and why behind a specific result. Assisted Insights is most effective when data-sets are validated and cleaned for accuracy and relevance in the generated results, and it’s beneficial for both line-of-business users and experts who need a baseline analysis to work with when helping answer end-user requests for reports. Read more: Yellowfin Assisted Insights for Self-Service Analytics2. Yellowfin Signals
Automated business monitoring (ABM) is a powerful and useful capability of modern business intelligence solutions that comes in many different shapes and forms depending on the vendor. ABM continuously monitors, scans and analyzes your data-sets to detect statistically significant changes and trends, using automation and machine learning technology to do so. It also automatically informs analytics users of what, when, where and why a particular change has occurred, to assist people in acting on that change faster and more effectively. Why this is useful for self-service BI users is to lessen the time they require to ask an expert to do this for them. Yellowfin Signals is Yellowfin’s exclusive ABM feature that can be run by users on Yellowfin dashboards and reports. Signals runs machine learning algorithms and time series analysis to discover important and relevant disruptions and trends in data. How it differs from standard alert-based reporting is it scans all data defined in a given view, instead of being limited to scanning data setup for individual reports with defined thresholds.Example 2. Yellowfin Signals and Automated Business Monitoring in action
Signals goes the extra mile and is able to deploy several algorithms to identify a broader range of relevant changes, including trend direction, outliers, total and average, volatility and step shifts. It also accounts for natural seasonal variation and data, and fine-grained control of thresholds and algorithm patterns. It also can be displayed within the same interface (dashboard or report) the user is already accessing, meaning they have all the contextual information needed in one spot. Signals can be set up in both simple and advanced configurations depending on the user, but both provide personalized results based on data permissions and how the user interacts with Signals. The best part is the alerts that Signals deliver to the given user are generated in natural language, providing an easy-to-understand explanation and analysis on the detected data anomaly that better helps users understand the cause of the auto-detected alert much easier. Read more: Yellowfin Signals for Self-Service Business Analytics3. Yellowfin Broadcast
Modern self-service BI solutions provide many helpful features that make the process of analysis and detection of insights easier for line-of-business users, as shown by both Assisted Insights and Signals. But having these automated features in your software is not enough to guarantee all your users will be able to get value from it; you also need ways to be able to easily send dashboards and reports and the results within them to people across the organization. Broadcasting is a feature of Yellowfin that allows users to send a report or dashboard to one or more users via email. These results can be sent based on a defined schedule and parameters, and multiple formats are supported, including a direct link, PDF attachment, HTML, CSV, and more. To get an idea of what can be sent, view the video below.Example 3. Yellowfin Broadcast of Reports in action
A user can even set up a personal broadcast, which only sends the results to themselves, or send broadcasts to be pushed out using FTP or Save-to-Disk schedules (with specified server paths which allow reports to be periodically saved to the local server’s disk). A report can be set up to have more than one broadcast schedule, which allows users to set up many different schedules and audiences for the same report, and it is very simple to do - just click the broadcast icon at the top of the associated report to begin configuration.Conclusion
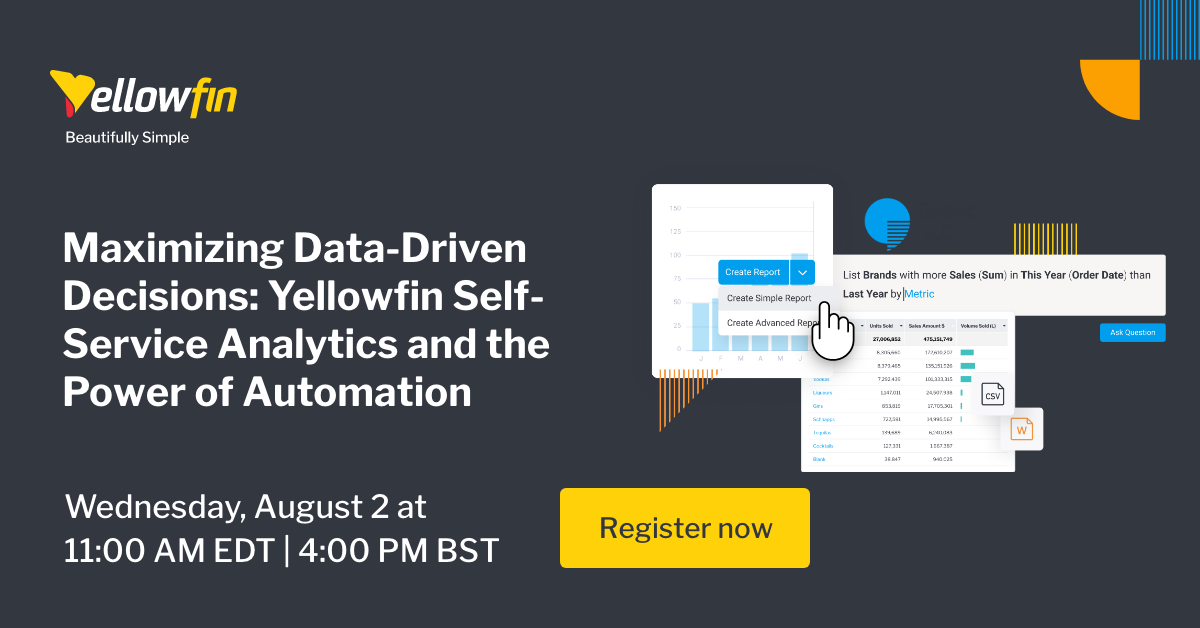
For more information on embedding Yellowfin's self-service analytics features, we recommend to join our upcoming webinar, "Maximizing Data-Driven Decisions: Yellowfin Self-Service Analytics and the Power of Automation", which will explore all three featured - Assisted Insights, Signals and Broadcast - in a detailed demo walkthrough. Perfect for business users and experienced data analysts alike, this webinar promises valuable insights into harnessing the full potential of Yellowfin's self-service analytics. Watch on-demand today.