
 Models Are Created Equal")
Not All Natural Language Query (NLQ) Models Are Created Equal
Yellowfin has always been driven by the belief that Business Intelligence (BI) solutions should be accessible and useful for the average business user - without the need to rely on a data analyst, or to have data analysis skills.
We believe that the BI industry has, over recent years, provided a multitude of solutions that are targeted at the needs of the data analyst, but ultimately has failed to build solutions for the average “information consumer” - who needs data to make decisions, but isn’t an expert.
Self-service analytics and automated analytics are becoming increasingly sought after capabilities within modern organizations, as a way to open up the value of analytics solutions to more people, without needing advanced technical knowledge. Yellowfin has pioneered a number of unique innovations within these categories for this very reason, aimed at the needs of the information consumer, including:
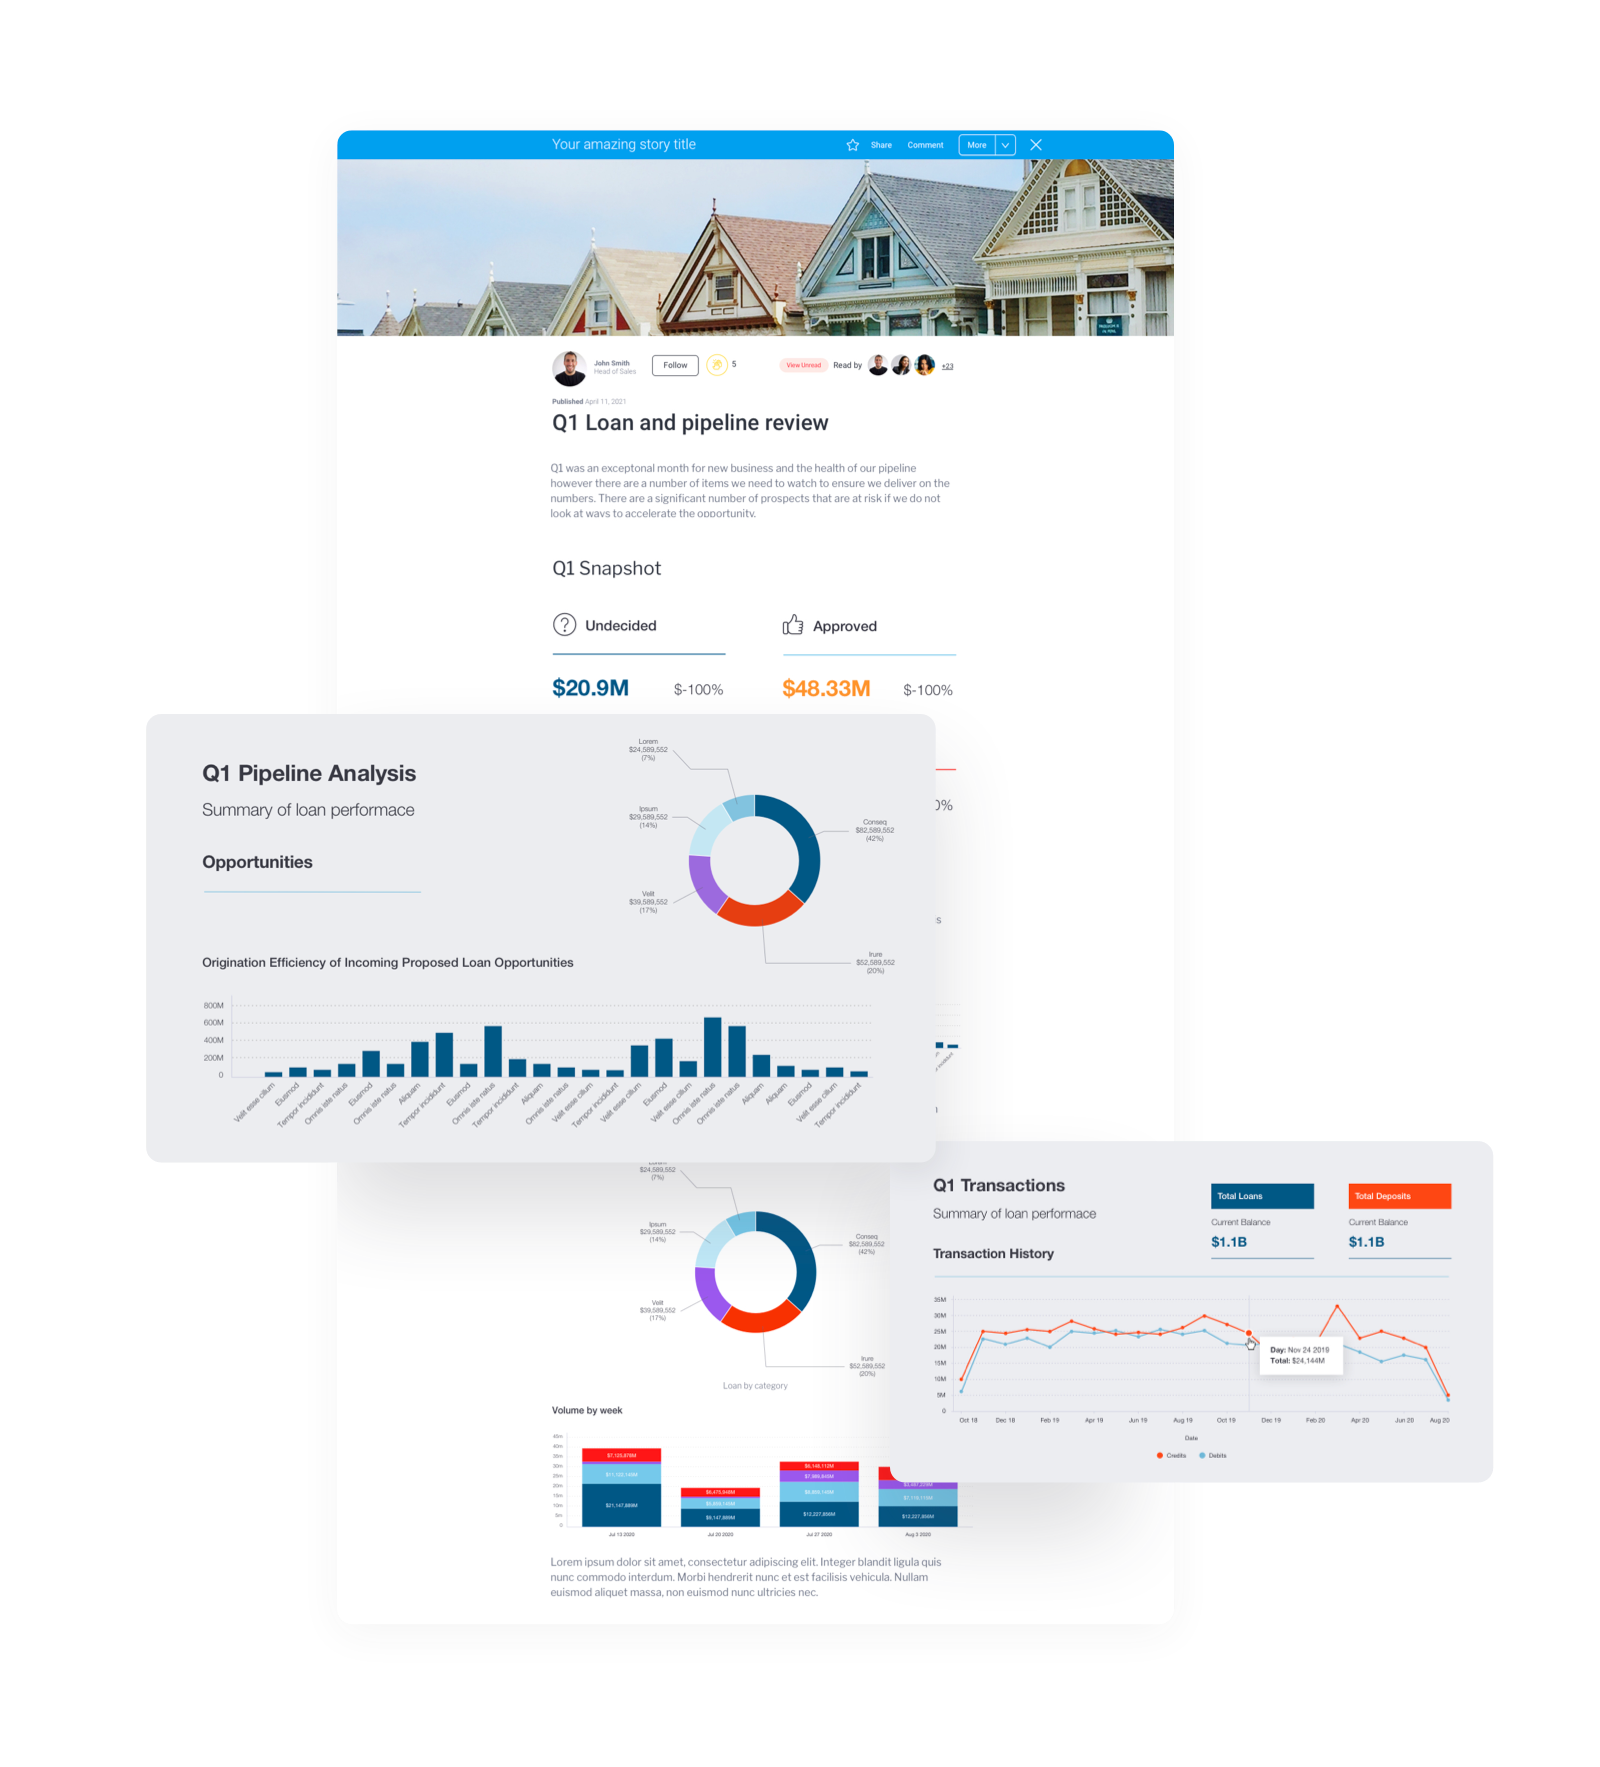
Stories - Yellowfin Stories allows a knowledgeable business user to provide the full context behind the numbers. Modeled after popular story-telling sites such as pudding.cool and medium.com, reports and visualizations can be embedded alongside text that provides the story behind the numbers. Stories can also combine images, video and even reports from other BI tools such as Power BI and Tableau. Stories are ideal for the information consumer who has trouble interpreting slabs of data or complex visualizations, and will benefit from a step by step explanation from an expert.
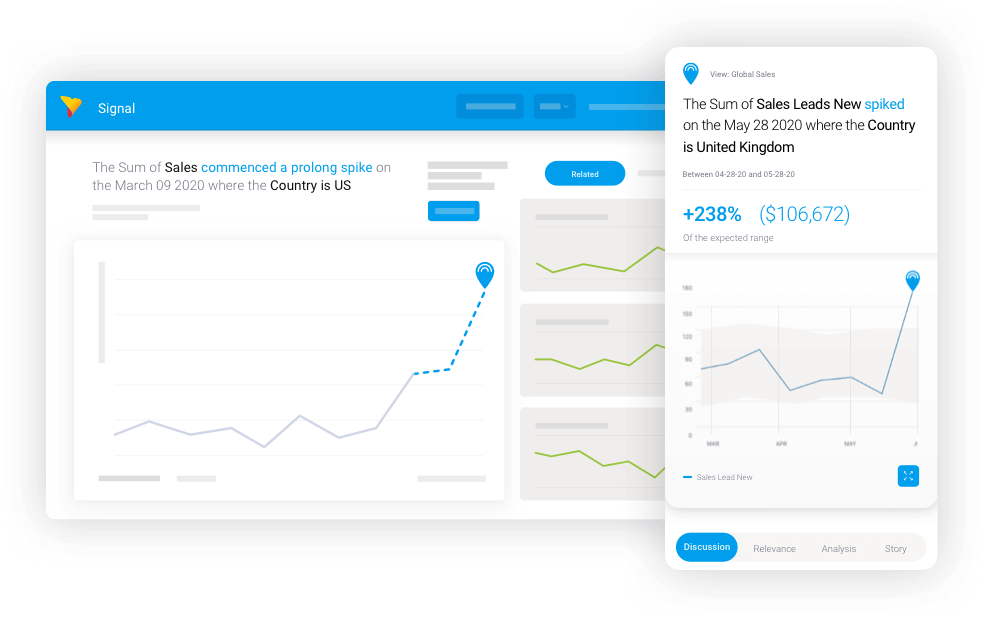
Signals - Yellowfin Signals is a fully automated tool that scans relevant data looking for insights that are likely to be significant for a business user. This includes large changes in values, sudden spikes and drops and other patterns such as changes in volatility. Signals analyzes data at every level, looking at multiple date ranges and multiple dimensions and combinations of dimensions, faster than any human analyst could. Best of all, Signals keeps working even if you are too busy to log in, and will notify you of your top insights.
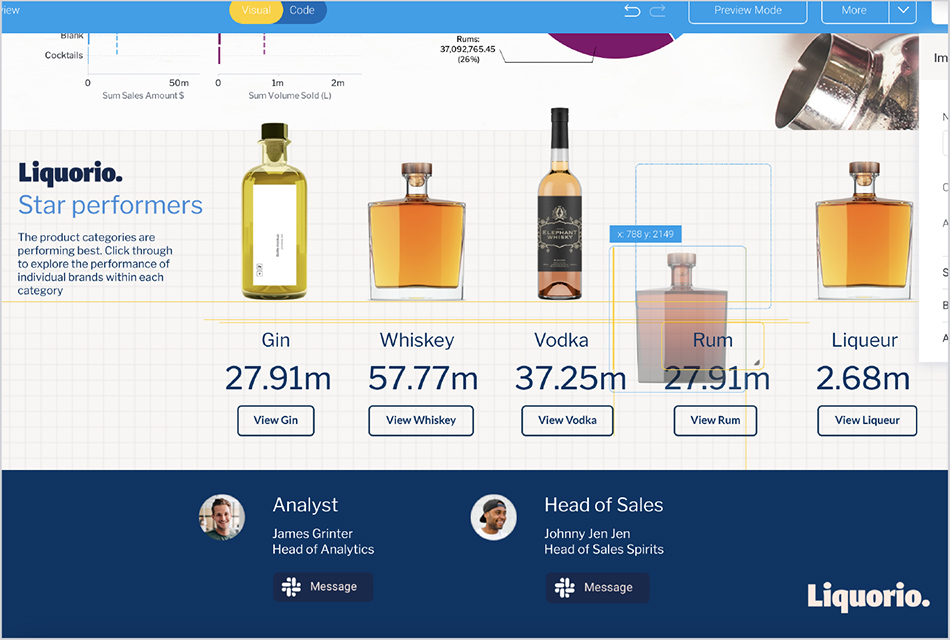
Dashboard and Presentation Canvas - Yellowfin Dashboards are like no other. We know that Dashboards can be bland and lack context. To generate engagement and to keep users coming back to your data solution, we recognized that we needed to remove the constraints of other BI tools and provide your designers the tools to design the most visually appealing Dashboards they can. Presentations takes this further by extending the canvas capabilities to a familiar slide-show paradigm, ideal for taking busy executives step-by-step through the latest numbers - all live and secure within the system.
In addition to these features, Yellowfin has also launched a feature, called Yellowfin Guided NLQ, that aims to further streamline the start of a BI user’s analytics journey by making the process of asking complex data questions as simple as possible.
Is Natural Language Query (NLQ) the answer?
In recent years, Natural Language Query (NLQ) capability has become mainstream, with most if not all BI vendors now offering this feature. On the surface, this NLQ capability looks pretty similar across many analytics solutions, ie. blank search bar, user types a question, viola! A data visualization of the result is then generated as an answer, and users are expected to be able to know what to do with it.
NLQ was touted as a solution to finally bring data to the fingertips (literally) of the information consumer. Yellowfin studied the emergence of these new NLQ tools as well as speaking to Customers of some of the BI vendors who offered them. What we learned was concerning, and we believe that these NLQ features fell short in a number of key ways. In particular, the architecture of many BI tools made them time-consuming to configure, they were still hard to learn and use for the non data-savvy business user, and the questions that could be asked were quite limited.
When building our own solution, we decided to focus on these key shortcomings and finally realize the potential of NLQ for the information consumer with Guided NLQ. Below, we break down the limitations of traditional NLQ offerings from other BI vendors, exactly how we came to design Guided NLQ, and why we built it for every type of BI user - expert or beginner - in mind.
Data Setup + Usability + Query complexity is key
Data Setup
Yellowfin has always been built on the basis that good data analysis needs to be backed by well-curated data. That is, data that is first of all good quality and well structured, but also one that has a robust and comprehensive meta-data model.
The meta-data model provides a usable business layer on top of what is essentially a technical layer (database tables). This includes hiding technical complexity such as joins, defining meaningful business terms on top of technical terms, and predefining formats, default aggregations, calculations and so on. In Yellowfin, this View is a mandatory step that must be setup prior to engaging in any data analysis, but once setup; it can be reused by all and ensures consistency and therefore trust in the data.
Guided NLQ works directly on top of this view with no further setup required on the part of the user. Other BI tools do not require the use of a meta-data layer, and therefore the process of setting up the data to enable NLQ is often more complex and time-consuming in comparison.
Usability
Almost every natural language query offering out there presents the user with a blank toolbar and prompts them to start typing.
This sort of user interface is fine if the user has some idea of what they are looking for, and how to articulate that. The challenge, however, is that the user then has to master asking the question in the specific syntax that the specific NLQ offering supports. Our feedback from customers suggests that this is a far harder process for many users than these BI vendors claim, and that a lot of users simply try it for a short period of time, and then give up.
When designing Yellowfin’s NLQ solution, we spent a lot of time getting the balance between giving the experienced user freedom to type what they knew to get a fast result, and the need to provide step by step guidance for novice users. The result is a unique balance of typing and popup suggestions that we appropriately termed Guided NLQ, given that it makes the traditional NLQ process a fully guided experience.
Basic question types with Guided NLQ are pre-configured into the system, and first time users can navigate a series of suggestions to quickly learn how to build very complex questions. Experienced users, meanwhile, can fly through, using the tab key to auto-complete partially typed terms.
Query Complexity
Once the interface was learned (assuming the user had not given up), the next limiting factor for users of competitor solutions was the complexity of questions that could be asked. As anyone who can write SQL will know, sometimes a simple question can result in a very complex query.
Yellowfin already has an incredibly rich and complex query generation engine. Virtually any SQL query can be generated including complex calculations, sub-queries, even post-query result set merging of disparate data sources. These are all powered by our rich drag and drop interface. Guided NLQ was designed from two directions. On one side, we designed an internal API to sit on top of our Query engine, such that any Query could be automatically generated programmatically.
At the same time, we documented as many business questions that we could think of. We then analyzed the similarities in these questions and grouped them into question types, and mapped these to the API. This allows for query complexity that simply cannot be matched by any of our competitors.
What follows are some examples of real questions from Guided NLQ to demonstrate the range of business questions that can be supported.
All the basics are covered…
Single or multiple metrics by a dimension:
- Show Units Sold(Sum) by Premium Category For Last Quarter (Order Date)
- ShowUnits Sold (Sum) And Sales Amount $ (Sum) By Product Category For Last Quarter (Order Date)
Metrics over time with different date aggregations:
- Show Sales Amount $ (Sum) by Order Date in Day For This Year to Date (Order Date)
- Show Sales Amount $ (Sum) by Order Date in Month For This Year to Date (Order Date)
- Support for simple to complex Where clauses…
- Show Sales Amount $ (Sum) by Order Date in Day For This Year to Date (Order Date) Where Product Category Is Whiskies
- Show Sales Amount $ (Sum) by Order Date in Day For This Year to Date (Order Date) Where Product Category Is Whiskies and Account Name Is Sam’s Club
Multiple flexible ways to enter dates:
- Show Sales Amount $ (Sum) by Order Date in Day highlight averages (Mean) For Q1 2021
- Support for calculations…
- Show Sales Amount $ (Sum) divided by Units Sold (Sum) by Premium Category For All Time
To the more complex
Ranking:
- Show Sales Amount $ (Sum) for top 5 ranked Brand by Brand For 2020 (Order Date)
Finding dimension values such as accounts that are new:
- List Account Names with no Sales Amount $ (Sum) in Q1 2020 (Order Date) but some q2 2020
Finding dimension values such as accounts selling more of one category than another:
- List Company Names with more Profit Margin (Average) in Camp Regions Europe than North America For Last Year (Invoiced Date)

Comparing between time periods:
- Compare Sales Amount $ (Sum) between This Financial Quarter (Order Date) and Last Financial Week by Store Type
Create single or multi dimensional cross-tab reports:
- Crosstab Product Categories (Row) by Order Date (Column Header) in Day and Sales Amount (Sum)

Even though these are simple business questions that most business users could ask, most BI tools do not support this type of complexity. We encourage you to try these in any of these competitors -Thoughtspot, Tableau, Power BI - and then try Yellowfin Guided NLQ to see what they are all missing.
But wait, there’s more
When designing Guided NLQ, we focused internally on the solution itself, but also considered the various contexts in which it was to be used. We added some additional features that make the experience of using Guided NLQ even simpler and more powerful.
Here are some examples:
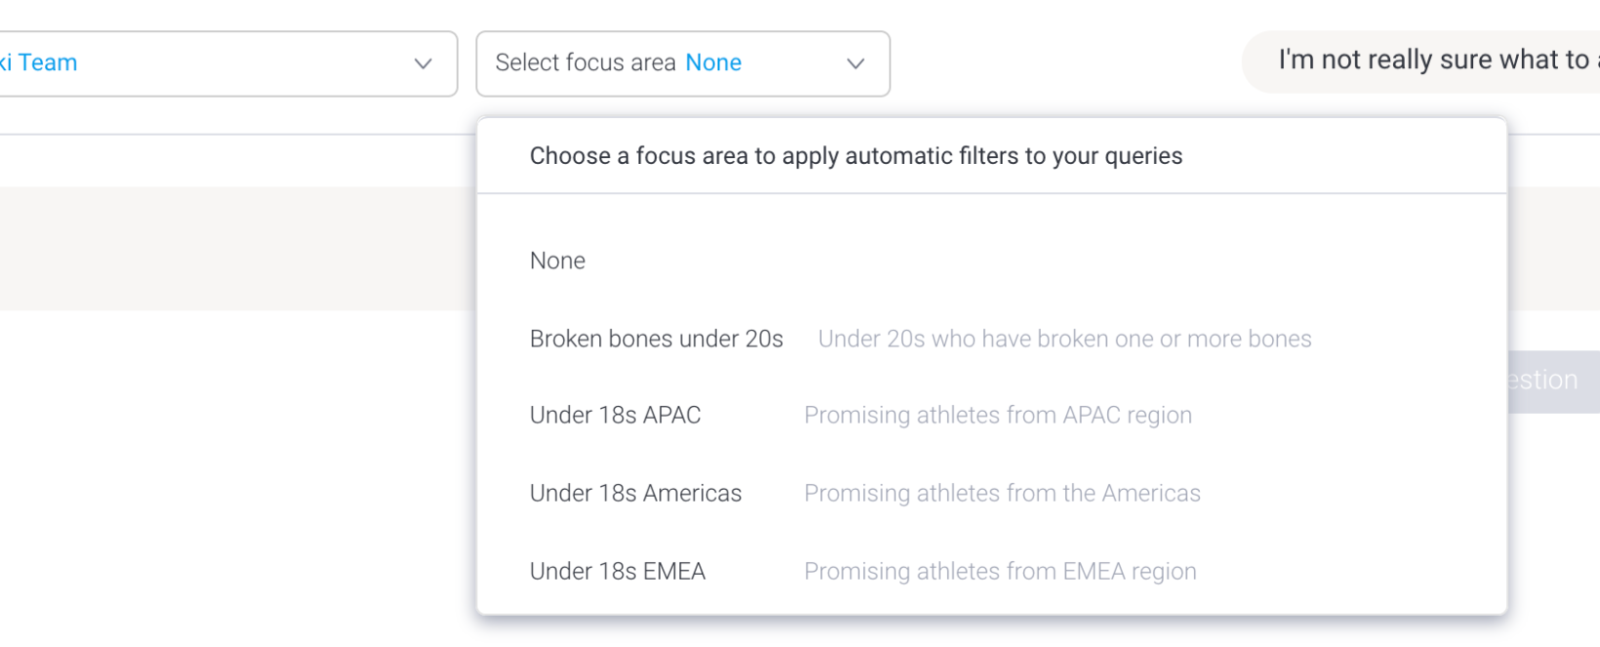
Focus on the data that is most relevant - some of our readers will be familiar with analyzing data from SalesForce.com, and will know the data model can be complex and confusing. When testing our prototype solution on Salesforce in order to understand Sales Leads data, we noticed that we were repeatedly having to input the same set of filters each time we asked a question. We realized that we had already solved this problem in Yellowfin with View-level filter groups - sets of predefined filters that can be dragged into a query, removing complexity and saving time. These filter groups can be reused in Guided NLQ to narrow down the focus of a query - automatically appending these filters to any query that is generated.
Sharing - Discovered insights multiply in power as they are shared with others. Yellowfin has always been built with collaboration in mind. Queries generated by Guided NLQ can be added directly to a Dashboard, Presentation or Story, as well as being opened in the Advanced Report builder and treated like any other Yellowfin content - whereby they can be modified, scheduled and shared with other users.
Embed - Embedding analytics puts analytics into the direct workflow of the end-user, ensuring that they have the information they need to complete the work they are doing, without the need to move to another application. Yellowfin has a rich set of APIs that enable individual content items (such as a Chart, Dashboard or Story) to be embedded in a third-party application or website, or even parts of or the whole Yellowfin UI. Guided NLQ is no exception and the NLQ search bar can be embedded using a simple embed link into your application, or an advanced API can be used for more fine-grained control.
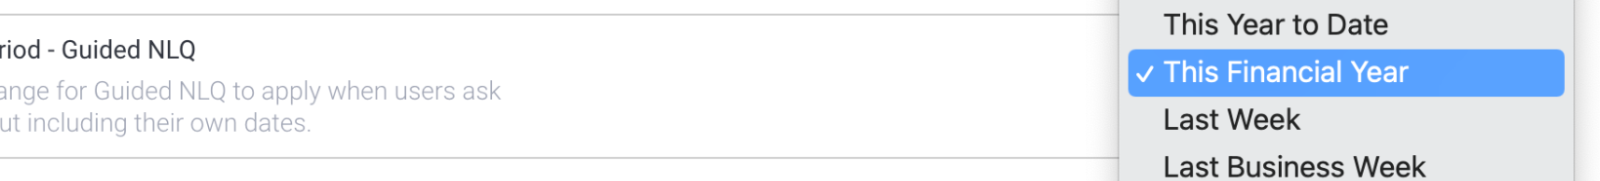
Protect your system - IT administrators have always been wary of giving unlimited power to end-users, whereby they could inadvertently build and execute queries that could bring the corporate Data Warehouse to its knees (or rack up very expensive bills). Yellowfin comes with a variety of protections and guardrails to protect users from creating runaway queries. These include system level safeguards such as row limits for data sources and views, but also the ability to define default date ranges. For example, your Database might contain 10 years of history which would be very expensive to scan if someone asked “Show Total Sales”, but forgot to specify any date period. Yellowfin allows default date periods to be configured that automatically append a date range (such as “For last month”) if a user forgets.
The foundation is always most important
Any information consumption solution needs to be built on a solid foundation. Fine-grained security, built-in governance tools, auditability, scalability, multi-language support including support for custom content translation and so on, are all part of the solid BI fundamentals upon which all Yellowfin solutions are based.
An NLQ solution not built with these fundamentals in mind can lead to data governance and data security issues, including lack of trust in data, IT headaches and unwanted security breaches.
Try Yellowfin Guided NLQ for yourself
Understand the business benefits of Guided NLQ and exactly how it opens up true self-service BI for everyone - not just analysts. Try our demo today.