

Yellowfin 7.4 Little Things: More information at the tip of your finger
Advanced tooltips allow you to drill-down, filter data, and perform analysis quickly and with ease.
Isn’t it confusing when you’re trying to fill out an online form, and a field with a generic name without much clarity, like ‘code’, appears? What exactly are you supposed to enter there? But then you accidentally hover your cursor over the field, and a little message appears telling you exactly what you need to write – ‘the 3 digit number on the back of your card’. That saves you the trouble of doing a Google search to try to figure out what information was required. This is why tooltips are a great idea for forms.
Here at Yellowfin, we have been using tooltips to highlight data for a while. But with our new release, Yellowfin 7.4, we’ve upgraded this feature vastly with advanced new functionality called Assisted Insights. This has led to a number of tweaks and changes downstream to enhance your experience. We’ve taken our tooltip functionality and remodeled it to not only share more information, but also provide more interactivity.
View exact values
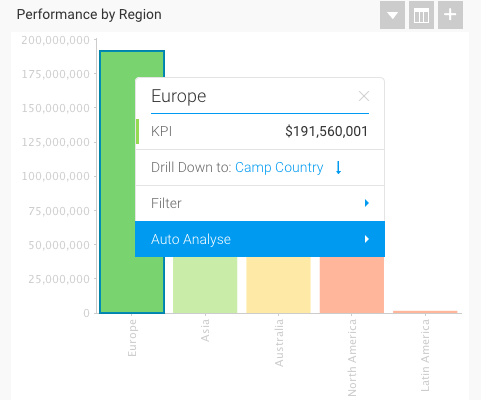
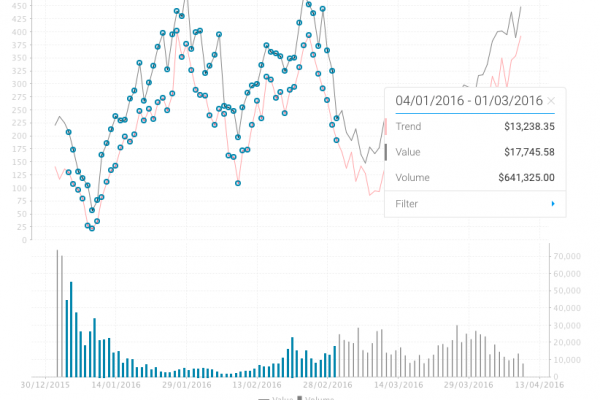
The advanced version of this feature now brings precise content information and a menu to allow you to perform different actions right there on your chart. Its simplicity lies in how easy it is to use. Hover your cursor over chart data (or right-click on it) and the tooltip will appear. You can see the exact value of the selection.
If you want to know the combined data of just a few of the fields, simply drag and select the fields (or as we like to call it, brushing) and the result will be displayed in the tooltip. Even the chart will highlight only the selected fields.
Interactivity in the tooltips
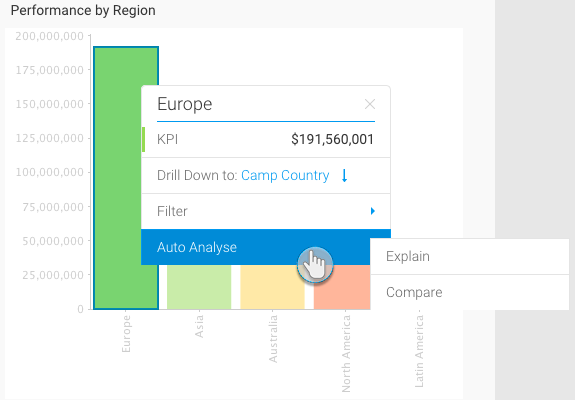
With more interactivity directly added to this little block of information, you can carry out drill-downs, filter data, and perform analysis quickly and with ease. This saves you from having to perform a heap of steps, and gives you instant information!
If you have the Assisted Insights feature enabled, you can instantly start analyzing your data directly through tooltips. Learn more about this amazing new functionality that we’re bringing you in Yellowfin 7.4.
Filter chart content
The Filter option lets you filter your chart or report content. Simply select an option to interact with your data. Choose Exclude to remove the content from the chart, displaying only the remaining data. Or view only the selected data, while getting rid of the rest, with the help of the Keep filter. You can always go back by applying Reset.
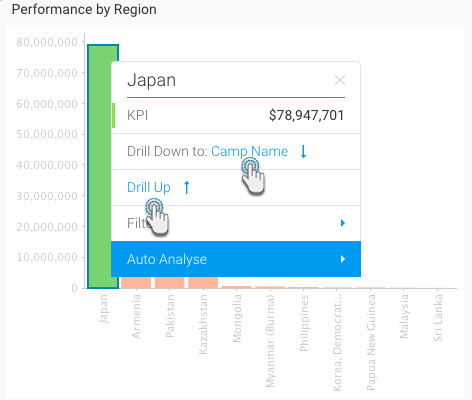
Easily track data hierarchies with data drilling
Another handy enhancement made to our tooltips is the inclusion of data drilling. You may be aware of our drilling functionality that lets you drill into more detail in multiple ways. You could click on a chart data to dive into further information (provided it contains another level of data), or use tooltips to see exactly what kind of information you will be drilling down to.
For instance, you have set up a drill down on your regional sales report to see how the various countries within each region are performing. On viewing the chart, the advanced tooltip will indicate that the region’s performance can be further drilled down to its countries’ performance.

You can perform the same step to see if there is another data hierarchy level within the country’s sales, or even use tooltips to go back to the previous level.
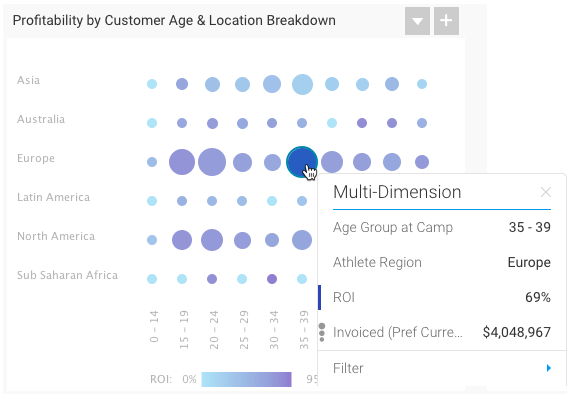
Easily distinguishable data
See multiple lines on your line chart? Tooltips will color-code them for you to help you distinguish each separate field.
Newly added icons will help you identify a field’s value. For example, the size of a value in a scatter chart. These simple formatting trends will make understanding data so much easier. And what’s more is that now you can even customise tooltips to match your corporation’s style using stylesheets. Armed with the knowledge of CSS, the power to format the tooltip’s look and feel, including its fonts, colors, spacing, and icons, will be in your hands.
Well there you have it – we’ve made tooltips much more user-friendly to improve your experience. If you value information made readily available to you, then you’re going to love using the new tooltips being introduced in Yellowfin 7.4.
See all this and more at our launch webinar on October 26th.
![]()