

Dashboard Design: 5 Essential Tips and Considerations for 2025
A beautiful dashboard requires careful consideration for the audience via its design. Here are 5 essential dashboard design considerations and tips for better looking dashboards.
For many people, it can be hard to interpret data if it isn’t presented in a simplified way.
They get cognitive overload, intimidated by what’s on screen, or misinterpret what you intend to communicate. Often, they may not use dashboards for their work altogether.
Good analytics and business dashboard software is designed in a way that provides BI dashboards that help every type of user, whether they’re a regular business person or advanced expert, better interpret, understand, and act on complex data situations - or easily identify what information is presented on the screen.
It’s not enough to present a set of metrics in tabular or graphical form to ensure all your dashboard consumers understand the data, and come away from the experience with information they can use; you need to put in attention toward dashboard UI design.
When properly implemented, the result is a BI dashboard that looks good, while providing all the information your users need in a clean, clear layout and logical hierarchy.
5 design tips for effective dashboards
Before you get stuck into our tips, we recommend reading our comparison blog, Dashboard vs Report: Which is Better for BI? This article dives into the purpose of a BI dashboard and its importance in providing actionable insights for your end-users. If you are still learning about what it is, please read our Business Intelligence Dashboard guide.
Now, let's dive into our top 5 dashboard design best practices - otherwise known as the do and dont's dashboard design:
#1 - Attention to fonts and typography
The text that accompanies a dashboard, its data visualizations and figures needs to be easy to read, and help guide the dashboard viewer. Always keep font types, sizes and styles to a minimum for maximum accessibility for your different dashboard audiences.
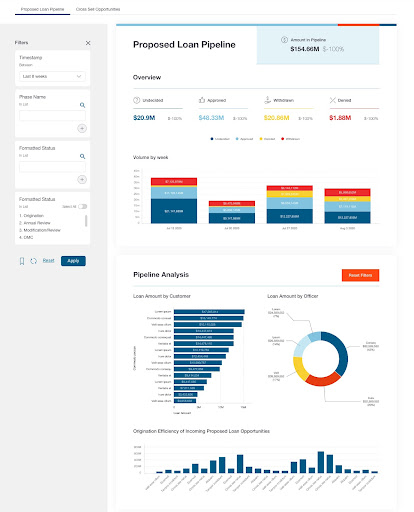
Roboto, Open Sans and Lato are all tabular Google fonts well suited for use on dashboards, reports and charts. These fonts are also highly readable at small sizes, clean and contain a wide selection of weights (eg. light, regular, bold, extra bold, and more). A basic design framework for dashboards we recommend is 1 font, 2 x weights, and 4 x sizes, as demonstrated in the dashboard example below.
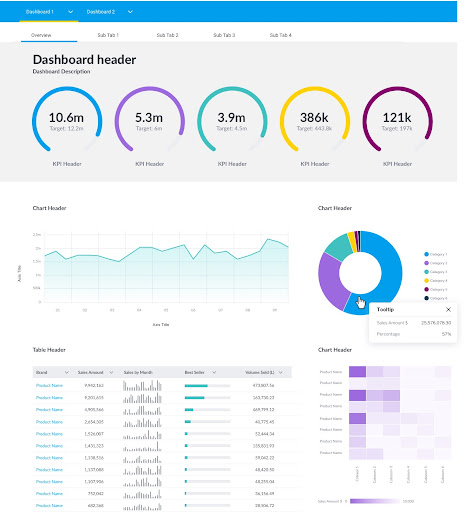
Generally, it’s advised to use a single font type across no more than 3 different weights (e.g. regular and bold), using a maximum of 4 font sizes on a dashboard. This allows variety to ensure you can guide a user's eyes to prioritized content, such as table or chart headers, whilst being able to have axis and labels that aren't too dominant. This is across a whole dashboard (including reports, charts, headers, labels, legends, notes and axis).
If using one font, adjusting the weight (thickness) of components such as headers and sub-headers, helps prioritize different information and lead the eye through a guided journey. Avoid using a single weight and size for all text and numbers; using varying weights can help control the user through the dashboard. Bigger KPIs will be consumed first, and then lead the user to more detailed analysis in subsequent charts and tables.
#2 - Choosing colors for your dashboard
Color is a great way of helping guide end users through your dashboard, charts or other data visualization. Dashboard color design is an important phase of overall dashboard interface design that can’t be underestimated or skipped over.
Color can be used to take users to data they need to see, in the order they need to see it. It highlights changes, and draws attention to figures and elements that need to be seen.
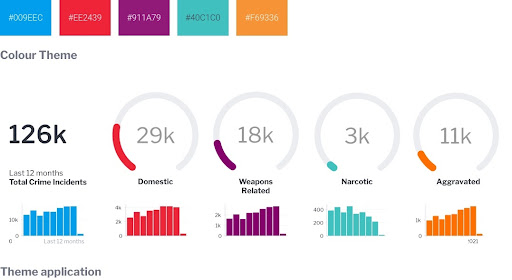
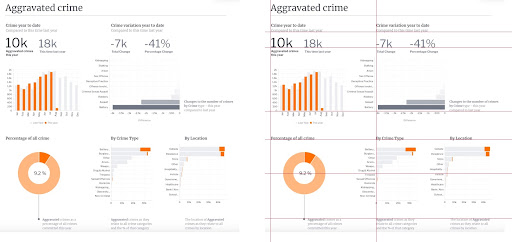
Firstly, pick a complementary color theme, and stick with it. You may choose to start with a key color such as orange, and then work to establish a theme that both compliment and contrast that base color. Consider how many are needed in a worst case scenario, such as a pie chart with 10-12 colors. This will require a full palette or theme of colors that can comfortably sit side by side with each other in your dashboards.
Once a theme is chosen, consider the usability aspects of color, such as color blindness. Ensure colors have enough contrast between each other so they are easily distinguished when side by side in a bar chart, or next to each other in a pie chart; low contrast values between the colors make charts, and the dashboards they’re used on, difficult to read.
Finally, consistency is key. Don’t color in everything, minimize color use, and ensure colors are the same across similar metrics. If ‘sales’ is blue in one chart, keep sales as blue on the next chart, or across tabs. If colors change throughout, users must work harder when they look at the dashboard (with many metrics) to establish the data story.
#3 - Hierarchy and grouping
It’s important you design the right types of dashboards to align with user needs, and analytic capability is considered. There’s no point creating an operational dashboard with detailed reports for a senior manager who may only be needing top level KPIs, and the opposite applies when delivering a dashboard to someone that has very detailed needs.
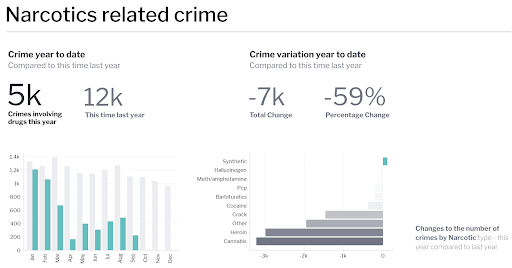
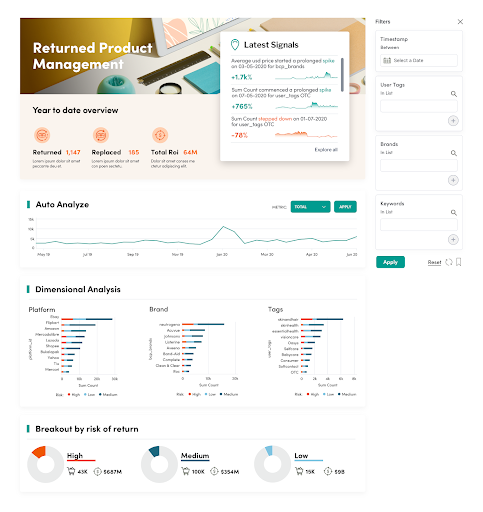
Start with grouping related data to tell an integrated story. Certain charts are best interpreted when seen in context together. By using graphic elements such as boxes, lines and shapes, group related data or visualizations, this will help provide visual cues on related data, and save people time from having to work out relationships between charts.
Use these groupings to guide the user to different parts of the experience, such as grouping KPI charts or charts that are telling different parts of the same story. In the financial example below, white boxes and dividing lines are used to group related areas of interest. This makes a complex set of data much easier to navigate. We recommend reading our blog on KPI dashboards for a look on KPI dashboard best practices.
#4 - Layout and alignment
As a very simple rule, it’s best to line things up to ensure best dashboard design principles.
This does not necessarily mean all components of a dashboard need to be the same size but, where possible, try creating visual alignment between multiple components to lower the effort required to visually navigate through the BI dashboard.
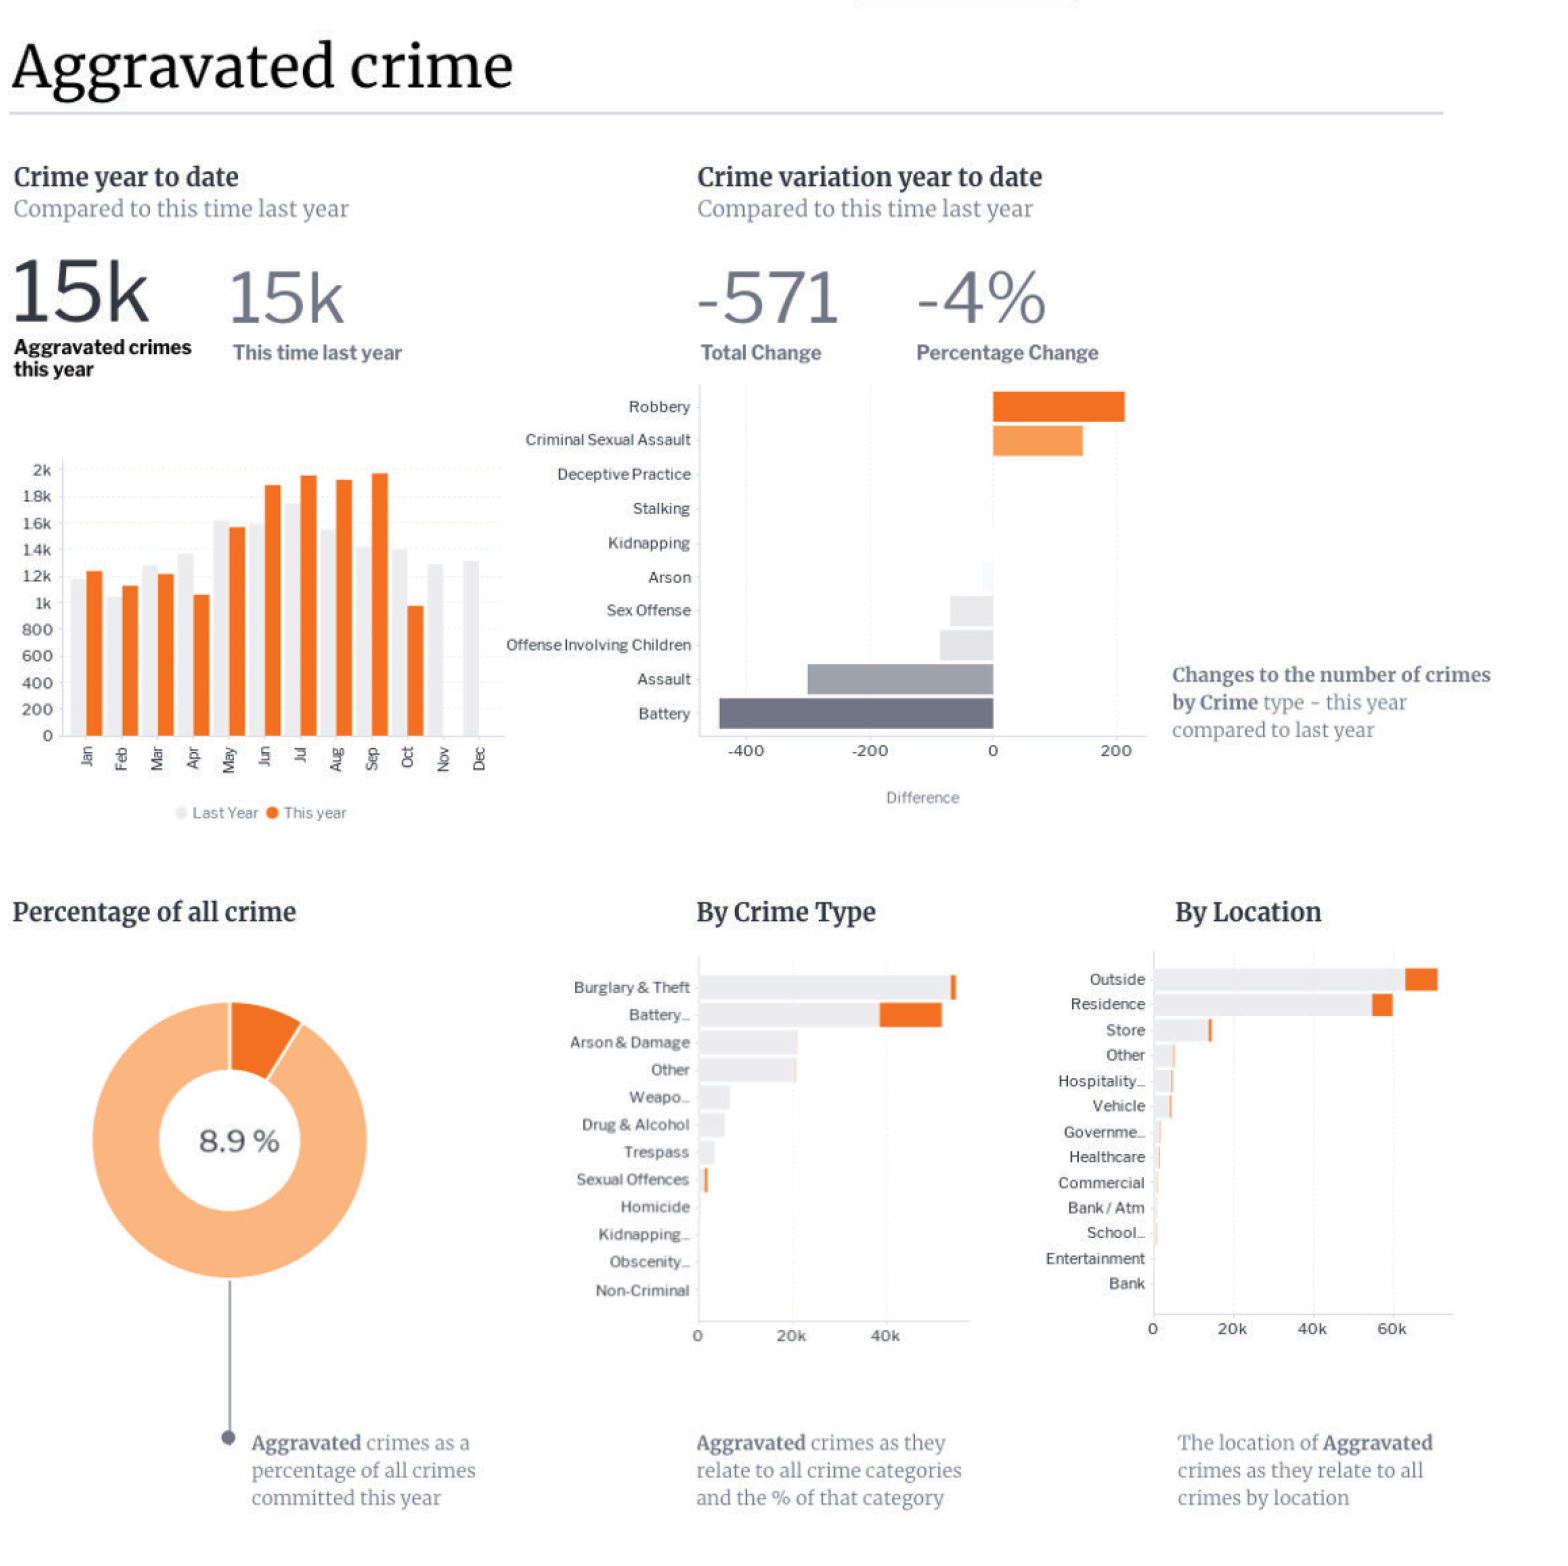
Using alignment helps contribute to hierarchy. Knowing the human eye tends to start top left and move towards the bottom right, consider visually aligning chart headers, charts, blocks of text accordingly.
Yellowfin Canvas allows elements to go anywhere on a page and therefore enables pre-defined grids to be broken. On rare occasions, it may help to break the grid in order to make certain information pop. This could work well on ensuring the component is first seen or not missed by end-users, and could include KPI dials, or an automation widget.
#5 - Images and icons
Use imagery, popular symbols, and icons to support and assist the dashboard consumer, as an opportunity to add necessary complexity to a BI dashboard, and as a great way of helping bring some ‘brand’ familiarity and personality to your data visualizations.
The key with images is they need to not distract from accessing data within a dashboard. Avoid adding complexity by overwhelming the dashboard with irrelevant imagery.
In this NHS example, some subtle imagery has been added into the header block to make the admissions dashboard more visually appealing, and to feel more like a ‘product’. This is done to increase the adoption of the dashboard by the non-technical user. You can read more about our work with these NHS dashboards in our NHS North Tees and Hartlepool customer case study.
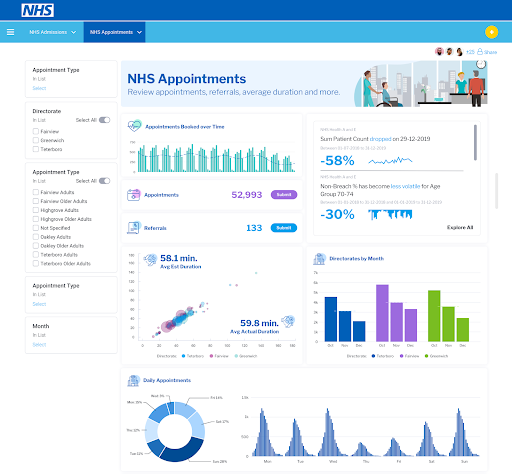
Icons are also a great way to provide visual shortcuts to common words or types of information, such as using a “$” to represent sales. This can save the user from having to read chart legends and understand types of charts and metrics being displayed. Icons can also become great learned visual prompts for those who need to continually check in and use a particular dashboard, with the icon making it easier to find the data they need.
If imagery and icons become overwhelming, they will tend to distract and confuse the user, which is ultimately why they should be used sparingly and carefully. If they don’t support the story or help the user, you probably don’t need them!
![]()
Frequently Asked Questions About Dashboard Design
1. What makes a dashboard design effective?
An effective dashboard design presents data in a clear, structured, and visually accessible way so users can quickly understand what is happening and take action. It balances visual appeal with usability by reducing cognitive overload, guiding attention through hierarchy, and ensuring data is easy to interpret for both business users and experts.
2. Why is dashboard UI design important for analytics adoption?
Dashboard UI design plays a major role in whether users actually use analytics tools. Poorly designed dashboards can overwhelm or intimidate users, causing misinterpretation or avoidance altogether. A clean, well-structured UI improves comprehension, builds confidence, and increases adoption across different user skill levels.
3. How do fonts and typography impact dashboard usability?
Fonts and typography directly affect readability and comprehension. Using too many fonts, weights, or sizes creates visual noise and confusion. A consistent typography system helps guide the user’s eye, highlight priority information like KPIs, and ensure labels and charts remain readable even at smaller sizes.
4. How should colors be used in dashboard design?
Colors should be used intentionally to guide attention, highlight changes, and reinforce meaning. A consistent color palette helps users quickly recognize metrics across charts, while proper contrast improves accessibility. Overusing color or changing color meanings between visuals increases cognitive effort and reduces clarity.
5. What role does hierarchy play in dashboard design?
Hierarchy helps users understand what information is most important and where to focus first. By varying size, weight, placement, and grouping, designers can guide users from high-level KPIs to detailed insights. Without hierarchy, dashboards feel cluttered and users struggle to interpret priorities.
Grouping related charts and metrics helps users understand relationships between data points without extra effort. Visual grouping using spacing, boxes, or lines creates structure, reduces confusion, and allows users to process complex information faster by seeing connected insights together.
7. How does layout and alignment improve dashboard readability?
Proper layout and alignment reduce visual friction and make dashboards easier to scan. Aligning elements creates a natural reading flow, supports hierarchy, and helps users navigate information efficiently. Misaligned or inconsistent layouts force users to work harder to understand the data being presented.
8. Should dashboards always follow a grid layout?
In most cases, grid layouts improve consistency and readability. However, breaking the grid occasionally can be effective when used intentionally to draw attention to critical elements like KPIs or alerts. The key is balance. Breaking the grid should highlight importance, not create disorder.
9. Are images and icons necessary in dashboard design?
Images and icons are not mandatory but can enhance dashboards when used sparingly and purposefully. They can add visual cues, reinforce branding, and help users quickly recognize metrics. However, excessive or irrelevant imagery can distract users and reduce focus on the data itself.
10. How will dashboard design expectations change in 2025?
By 2025, dashboards are expected to be more user-centric, accessible, and intuitive. As analytics reaches broader audiences, design must prioritize clarity, storytelling, and ease of interpretation. Dashboards that reduce complexity and guide users toward insights will outperform those that simply display data.
Check out the Yellowfin Dashboard Gallery
See how the above do and don'ts of dashboard UI design have been implemented using Yellowfin, and explore our interactive dashboard and design gallery for the best dashboard design examples.