Why Analytics and BI Reporting Tools Matter in 2026
Data is the biggest asset for any business, and its advantages are many.
Data can help enterprises better understand their customers, improve advertising campaigns and bottom lines, and personalize their content. However, you cannot access these benefits without proper embedded analytics and reporting tools that make data a true part of your day-to-day workflow. Because while raw data has a lot of potential, a business needs the right tools to access, manage, share and analyze it to great effect.
One key topic we encounter with our customers is what exactly the difference is between data analytics (or embedded analytics), data visualization and BI reporting. This article will help you understand the nuances, and why, ultimately, you need all of it in your software.


What is the difference between data analytics, data visualization, and BI reporting?
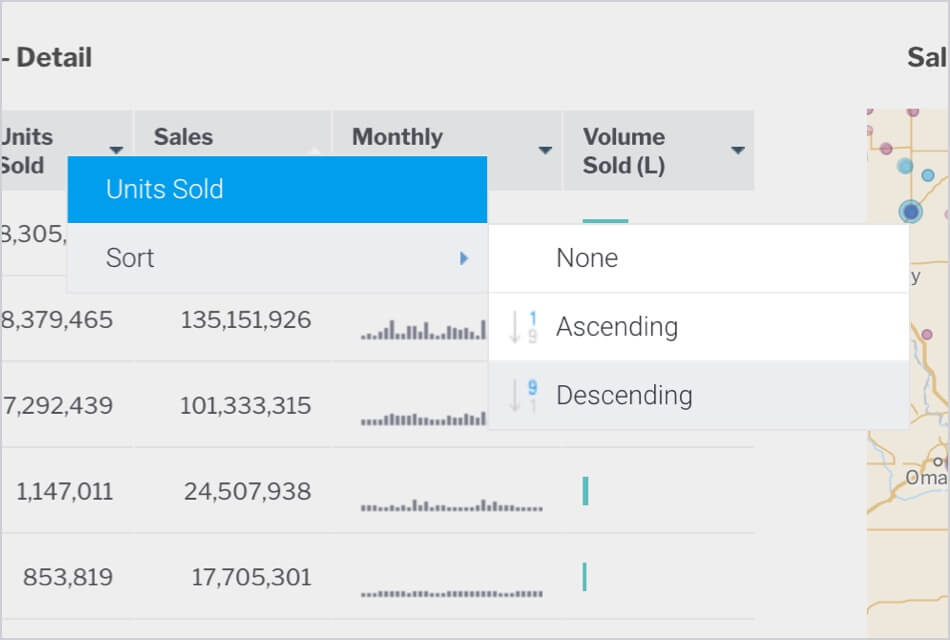
Data analytics refers to examining data sets to conclude the information they contain. It is a technique that enables a business to take raw data to extract valuable insights from it. Today, many of these solutions are called embedded analytics solutions, which refers to their ability to be integrated into the core transactional environments of your software. Data visualization is a term used to represent data through typical graphics. It uses charts, plots, animations, and infographics to represent data. These visuals display information that communicates complex data, and shows data-driven insights that are easy to grasp. Business intelligence (BI) reporting, or data reporting, is the process of collecting and formatting raw data. It also includes translating it into a clear format to assess the ongoing performance. This data can then be used to answer basic questions about the state of a business.Why are data analytics, data visualization, and BI reporting essential?
Data Analytics
Data analytics is generally used to help companies better understand their customers. It also helps in personalizing content and creating content strategies. With analytics, businesses evaluate their ad campaigns and develop products. Typically, businesses use data analytics to boost performance and improve their worth. The data can include historical or new information businesses get for a particular initiative. One example of data analytics is segmentation. It is used to help segment audiences by different demographic groups and analyze attitudes and trends. The businesses can then produce more specific, accurate, and just snapshots of public opinion. Learn more: Yellowfin Embedded Analytics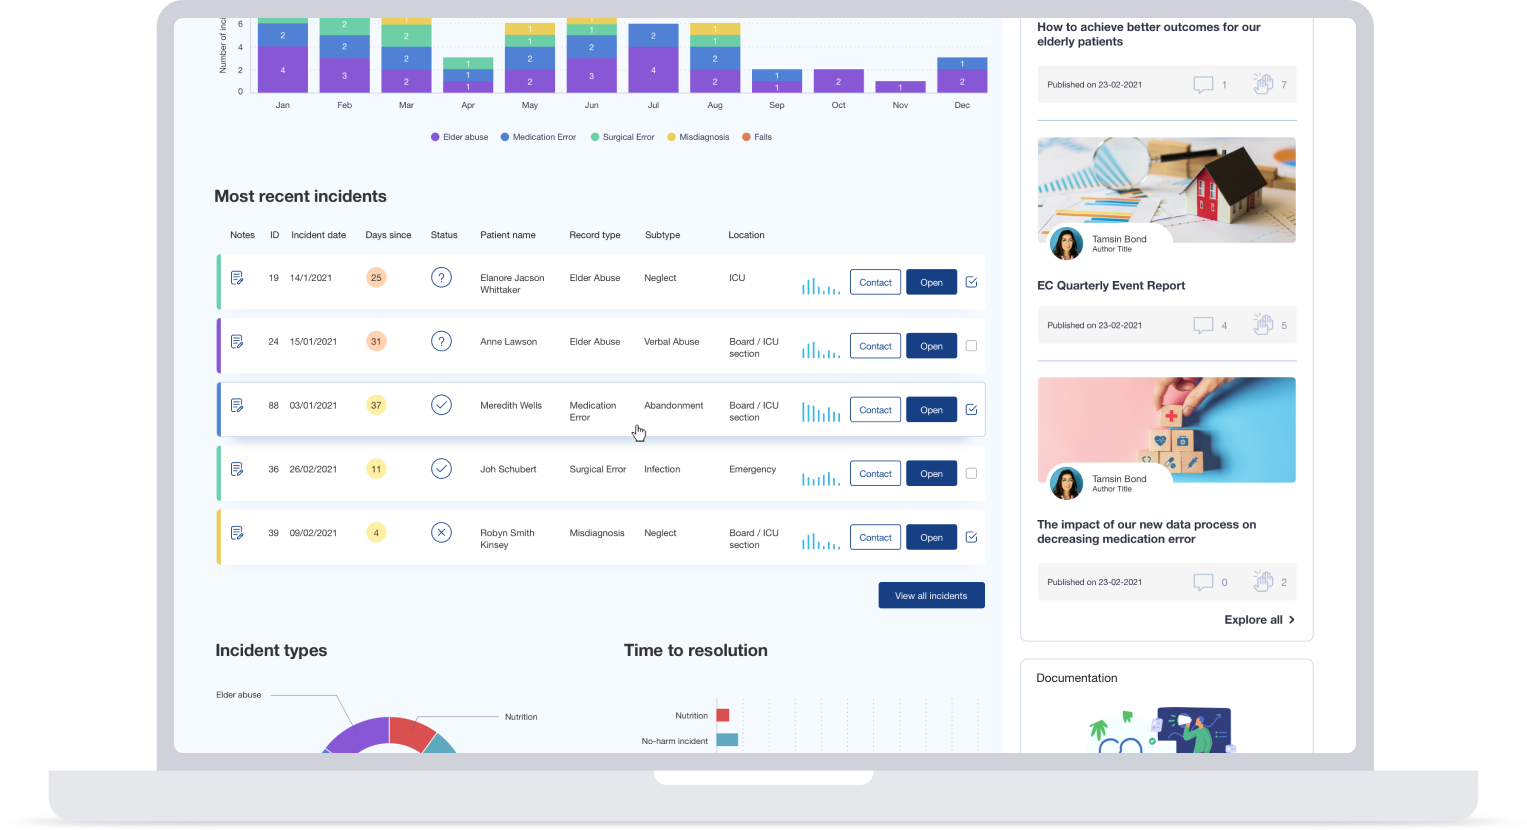
Data Visualizations
Data visuals are essential for businesses that want to communicate information clearly and efficiently. It is an advanced step in data analysis and data science. As per the report of Vitaly Friedman (2008), business groups use data visuals. They use it as an essential component of assertive connection. Visuals make research and data analysis effective and quicker. It does so by combining user-friendly and pleasing features. One example of data visualization is representing an annual budget. Budget numbers that are otherwise obscure and tough can be made simple and digestible with visuals like charts and graphs. This can then be delivered to better estimate the budget better. See more: Yellowfin Data Visualization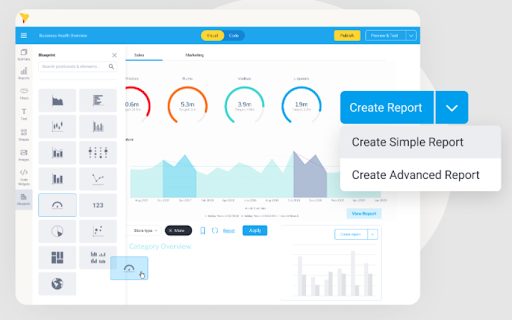
Data Reporting
Data reporting is essential when measuring the progress of every area of a business group. It informs professional decisions and day-to-day matters at any company. A data report is also essential to prioritize business tasks. It tells where a company should spend most of its time and resources and what needs more attention. Offering the ability for every user, not just the analysts in your business, to create, share and consume reports is essential to ensuring data is being used to drive business decisions. Learn more: Yellowfin Self-Service BI