

Yellowfin Cool Features Part 3: Advanced Query Generation
In this blog series, Yellowfin Chief Technology Officer (CTO) Brad Scarff breaks down some of the coolest and most unique features of the Yellowfin embedded analytics suite.
Advanced query generation is the use of sophisticated technologies such as artificial intelligence, machine learning and natural language to streamline complex data analysis.
To understand why it's an key part of the analytics tool you select for your organization or software application today, it's important to examine typical data scenarios today.
In part one and part two of the Yellowfin Cool Features series, we focused on some unique Yellowfin features that can make your standard reports look great, and also some powerful and flexible features to distribute reports via Advanced Broadcasting. In this article we will return to some foundational aspects of reporting - Advanced Query generation - and detail the many features of Yellowfin that allow you to dive into data.
Advanced Query Generation - An Overview
The majority of business intelligence (BI) and analytics architectures have, at their core, a data storage mechanism, and a way to query data from the data storage. The data storage is sometimes bundled with the BI tool itself, and whilst this can be convenient, in-built databases increase lock-in to the BI vendor and often limit scale and flexibility.
More commonly, a commercially available DBMS (Database Management System) is used. These can range from generalist multi-purpose DBMS such as Oracle, SQLServer and PostgreSQL, to special purpose Analytical DBMS that contain specific optimizations for high-speed analytic style queries (such as Snowflake and Exasol). Older, cube style architectures are still in use, but are waning in popularity - we won’t discuss those here.
For the most part, reporting DBMS queries are in the form of SQL statements. Most technical and some business users learn SQL skills at university or during their working career. BI tools mostly eliminated the need for users to write SQL, with SQL instead generated by a query generation mechanism, with the user employing different methods to define what they need from the query, usually by dragging and dropping reporting fields, specifying filters, sort order and so on via a visual-based user interface (UI).
More recently, typing questions in natural language has become a popular way for a user to generate or start the generation of a query. Yellowfin, for instance, leverages natural language to make the process of querying databases far more accessible and visual-based than traditional data exploration methods of yesteryear with Guided NLQ.
Like many things, SQL queries can range from the simple to the complex. Almost all BI tools certainly can cover the basics, but many are caught short when it comes to the generation of complex or highly complex queries. Yellowfin’s query generation engine is one of the most extensive and powerful available, and virtually any type of SQL query can be generated, and in fact, queries can be created that are not possible to create with SQL alone. We will dive into some of these capabilities within Yellowfin in the next section.
Basic Query Construction
Choosing your Data (SELECT)
Firstly, Yellowfin supports traditional column based reporting - fields are “dragged and dropped” from the list of available fields. Available fields are defined in the Yellowfin meta-data layer (known as a View). This layer hides the technical complexities such as join rules, and it is also where business readable names, formatting, aggregation rules, calculations and other configurations can be applied. Any configuration defined at the View level is automatically shared by any Report created off that view. This ensures consistency of reporting and efficiencies through reuse.
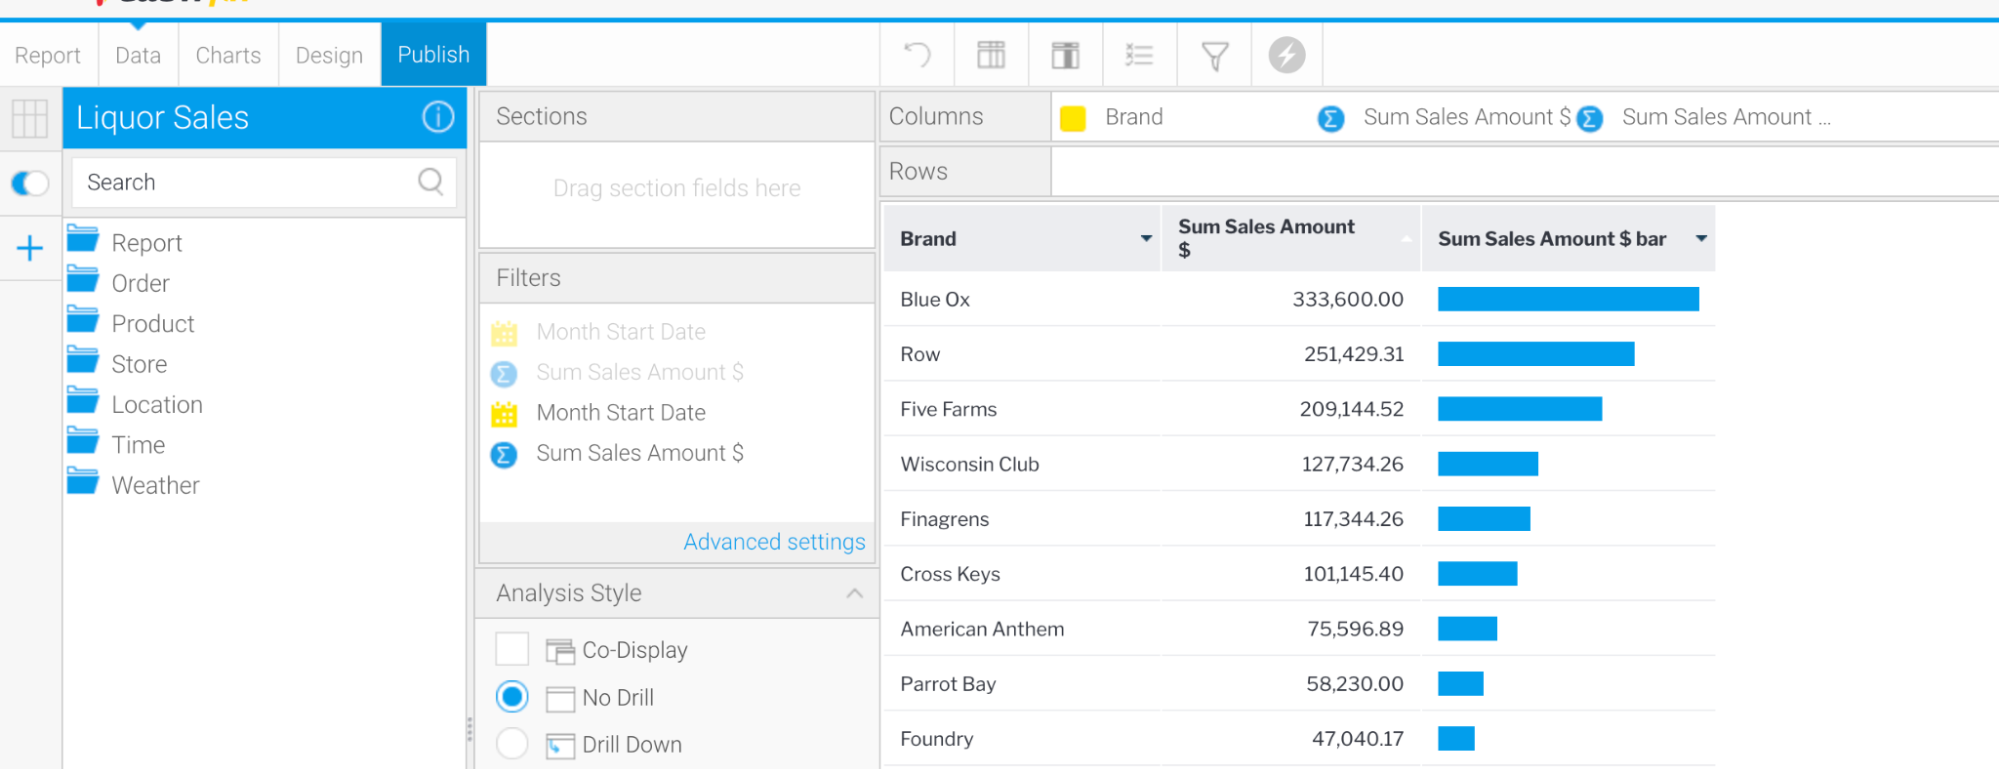
Data fields can be defined as columns or rows. This allows for the creation of Crosstab reports such as the one seen below. Multiple dimension columns can be added to both row and column sections, and multiple metrics can be added as well.
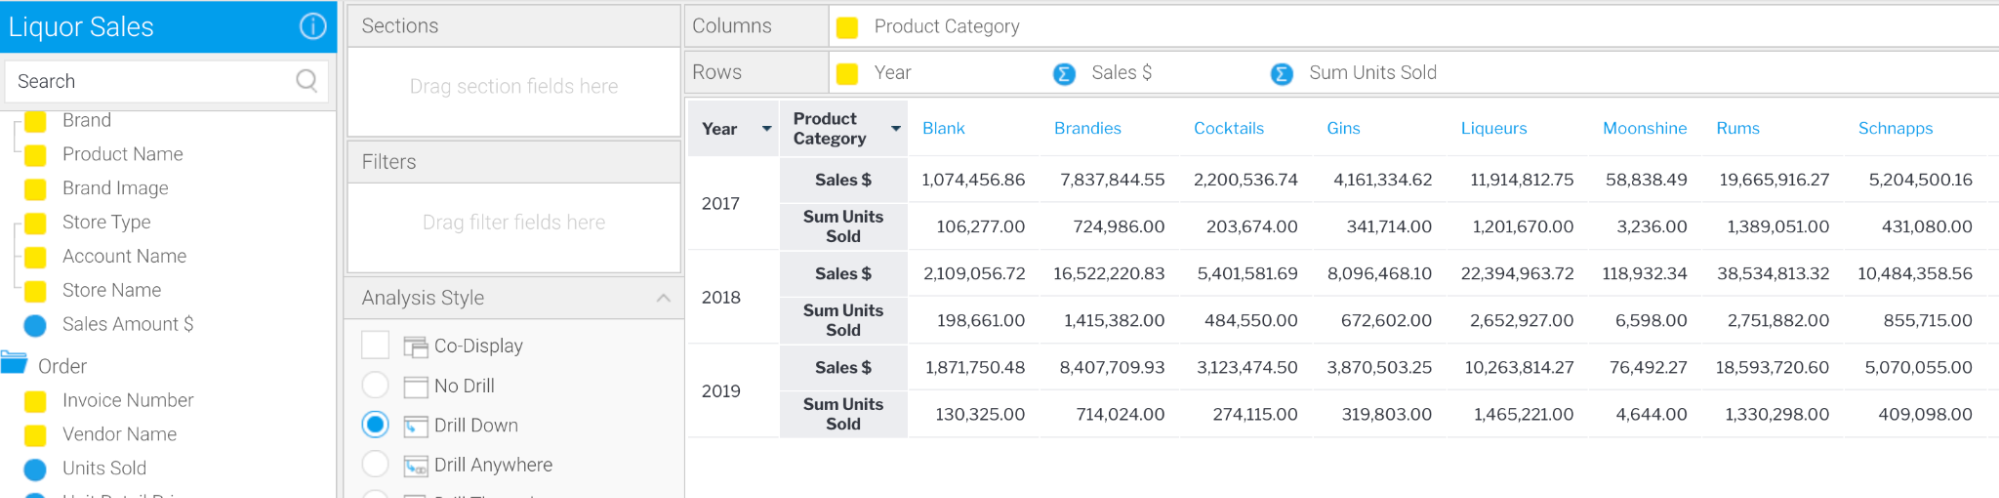
Note that at any time, the SQL generated by Yellowfin can be examined should the user wish to do so.
Creating calculations
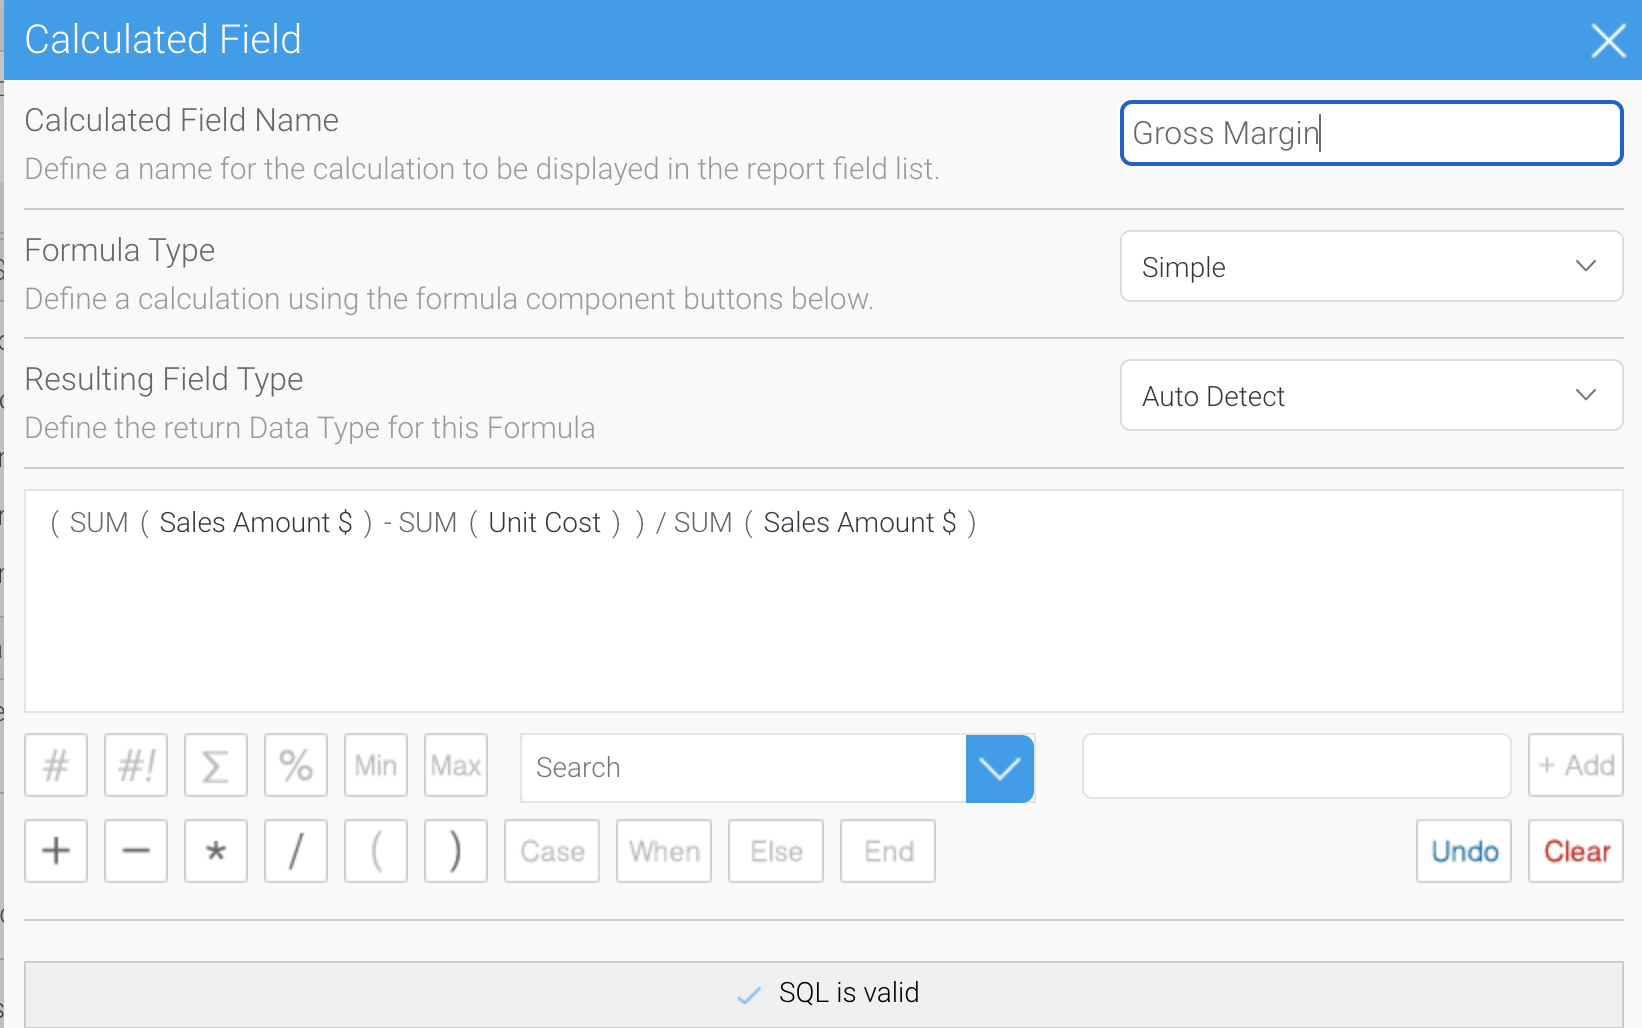
The Yellowfin Report Builder features an advanced calculated field builder. This allows additional columns of data to be defined, with the execution of this being passed down to the underlying DBMS. Users can build complex calculations featuring mathematical operators, CASE statements and predefined functions, and it is also possible to use freehand SQL to define the calculation.
In the example below, we have defined a gross margin calculation field that uses the aggregate values to calculate the margin. This could not be stored in the database as the query would end up aggregating average values and giving an incorrect result.
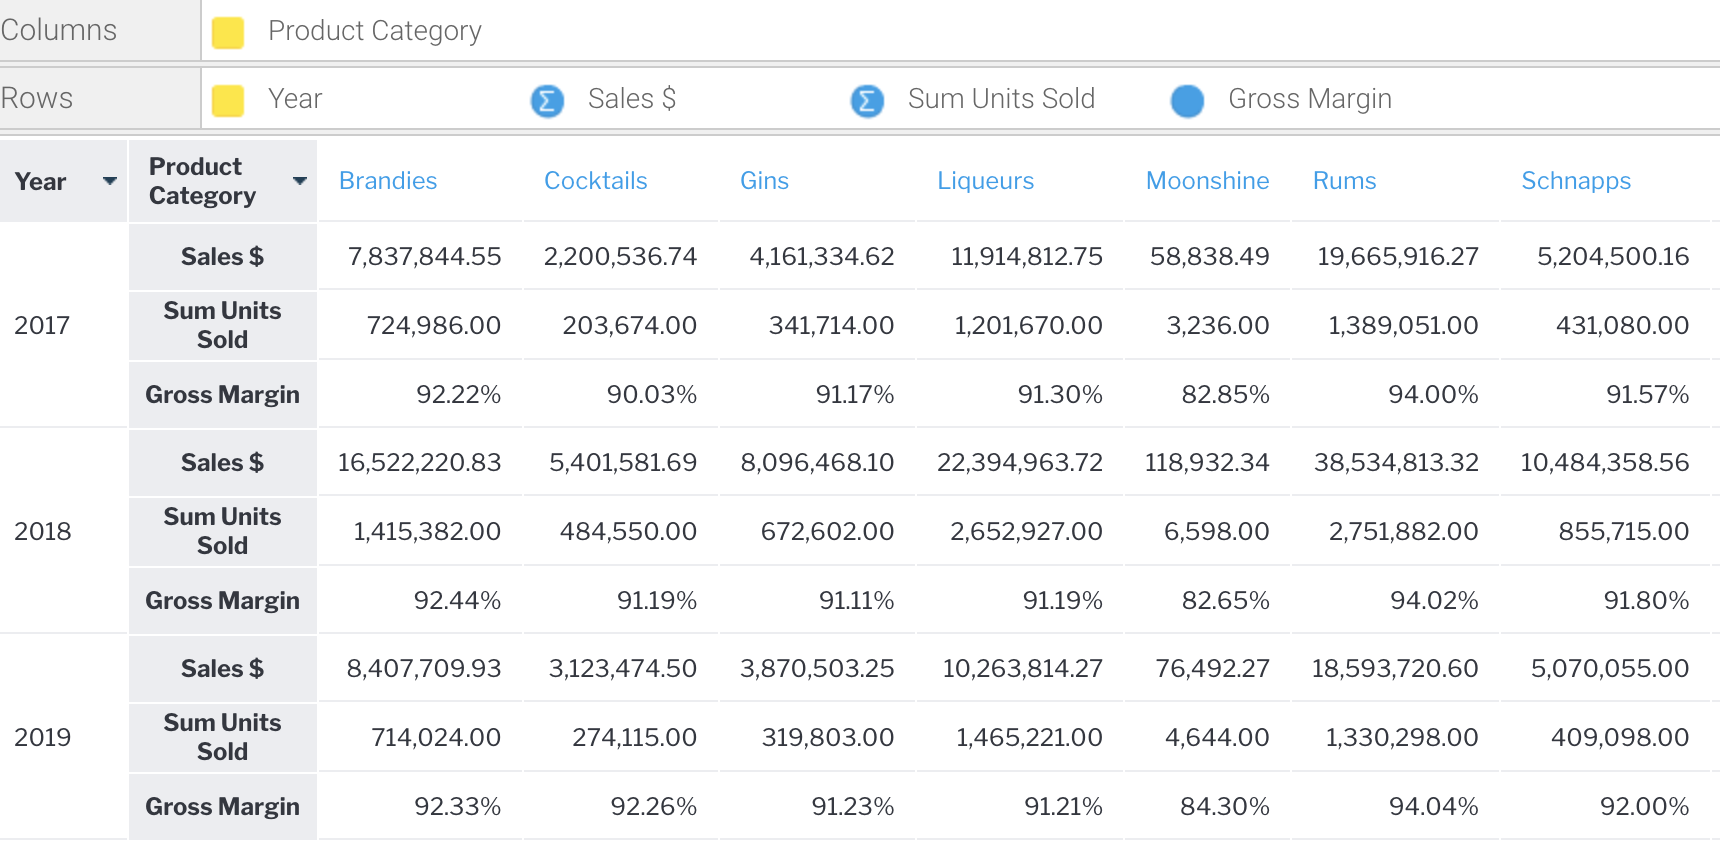
Recall from our first cool features blog that there are numerous formatting options available to format the data, column and row headings, section breaks, conditional formatting to highlight values and more.
Creating Aggregations (GROUP BY)
Yellowfin’s query generator will automatically create GROUP BY columns, and group fields that do not have an aggregation defined (such as SUM, COUNT, AVG etc).
Filtering your Data (WHERE)
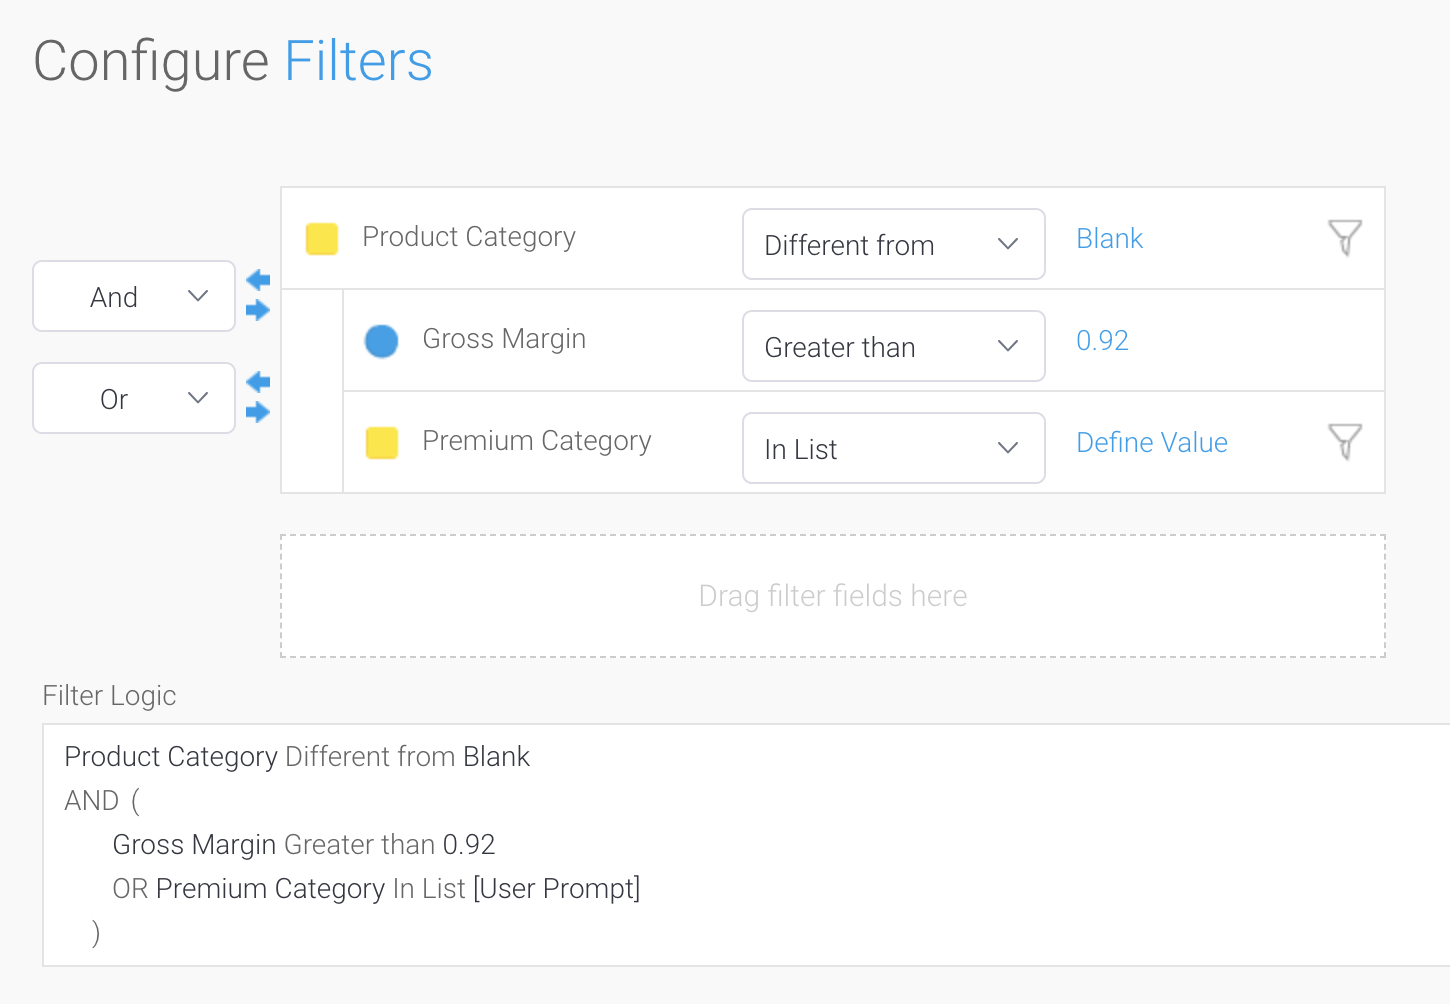
The Report Builder has sophisticated filtering capabilities which will allow you to generate any type of supported WHERE clause for your DBMS. Filters are defined by dragging a field into the Filter section. An operand needs to be defined, this could range from logical operators such as EQUAL, NOT EQUAL, GREATER THAN, LESS THAN, BETWEEN, IS or IS NOT NULL, etc that can apply to numeric fields and dates - as well as operands for categorical values such as in list, not in list, etc.
Advanced filter logic allows these conditions to be grouped into logical structures, incorporating AND/OR as well as parentheses. The values for filters can be preset at the report level (for example, always filter this report where the date = yesterday) or can be set as a user prompt. When a filter is defined as a user prompt, the filter will be displayed on the report and the end user can specify the values at report run time. Filters can be defined as optional or mandatory, and can be preset with default values. For filters that contain lists of values, the values can be pre configured in a variety of ways, including from queries.
If the queries are long-running, these can be configured to run in batch so as not to cause performance issues when users are dynamically accessing these filters. Finally, filters can be linked together, such that the values in one filter are limited based on the other filters that have been selected.
Filtering on Aggregations (HAVING)
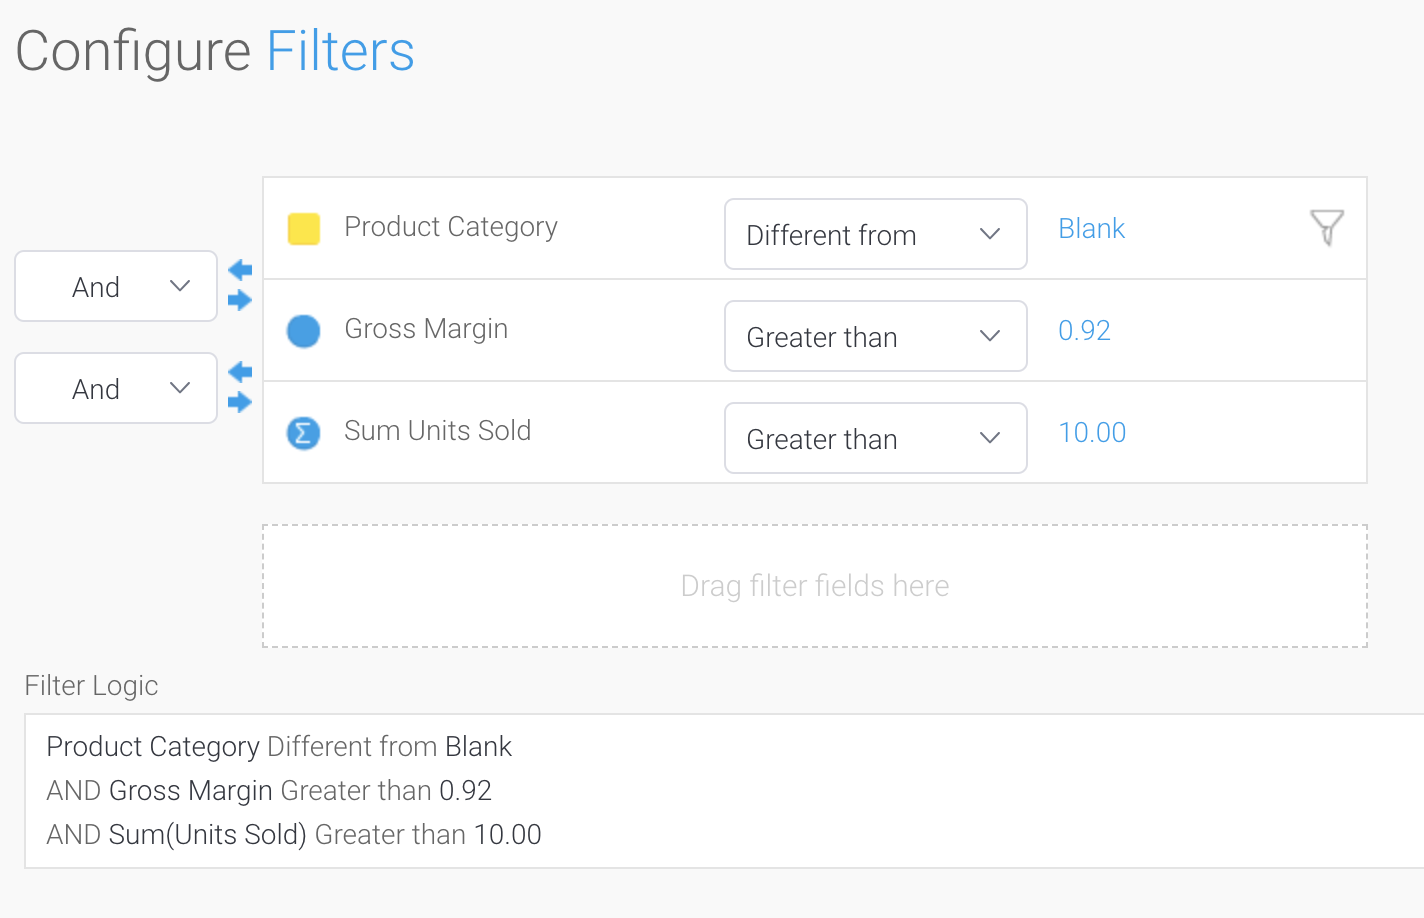
In some cases, you may want your query to filter data based on the result of an aggregation. By default, a SQL WHERE clause is applied at the lowest granularity of data, not the aggregated result set. Filtering at the aggregated level is achieved in SQL by applying a HAVING clause. When filtering on a metric, the user has the option to apply or remove the aggregation. If no aggregation is applied, the individual metric column is filtered in the WHERE clause. If an aggregation is applied, the filter condition is moved to the HAVING clause and the condition is applied at the aggregate level.
For example, if we have data containing product orders, if we filter where Units Sold > 10, this will apply at the individual order level, and the condition is added to the WHERE clause. If we apply the same filter, but add a SUM aggregation to Units Sold, this condition will be moved to the HAVING clause, and will filter after the data has been aggregated and grouped. So if we grouped by product name, we would get all products that had total Units Sold greater than 10, as demonstrated in the following screenshot.
Sorting your data (ORDER BY)
Sorting order can be applied to multiple columns, and there are options to sort raw values and post-formatted values. Custom sort orders can be defined for specific fields using Yellowfin Reference Codes. For greater flexibility, Yellowfin can apply advanced sorting on the post result set to achieve sorting that cannot be achieved via SQL alone.
Advanced Query Construction
Combining queries together with Subqueries
The Report Builder has the unique ability to create a wide variety of subqueries.
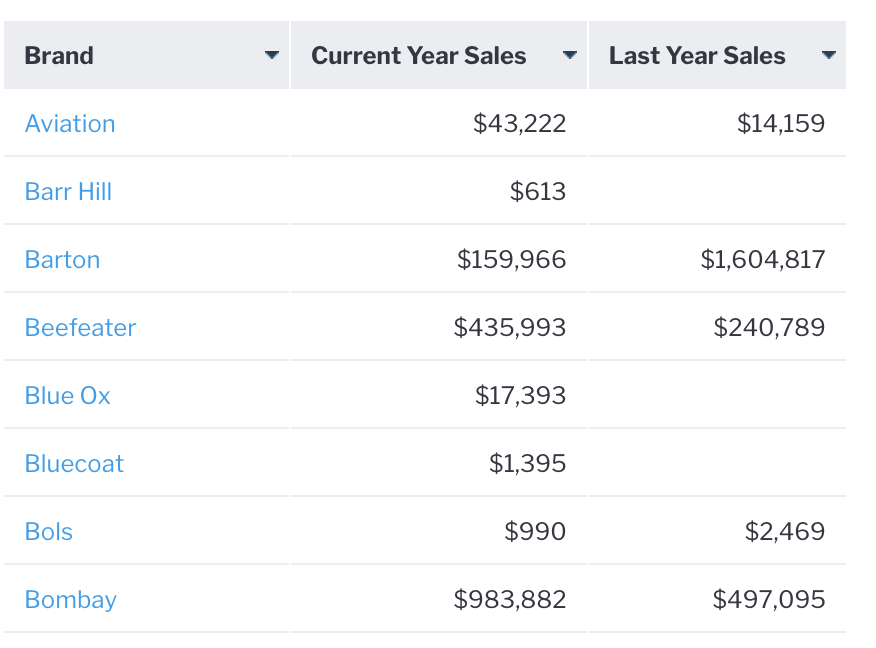
For example, a basic append-style subquery can be used to compare sales for a brand across two years.
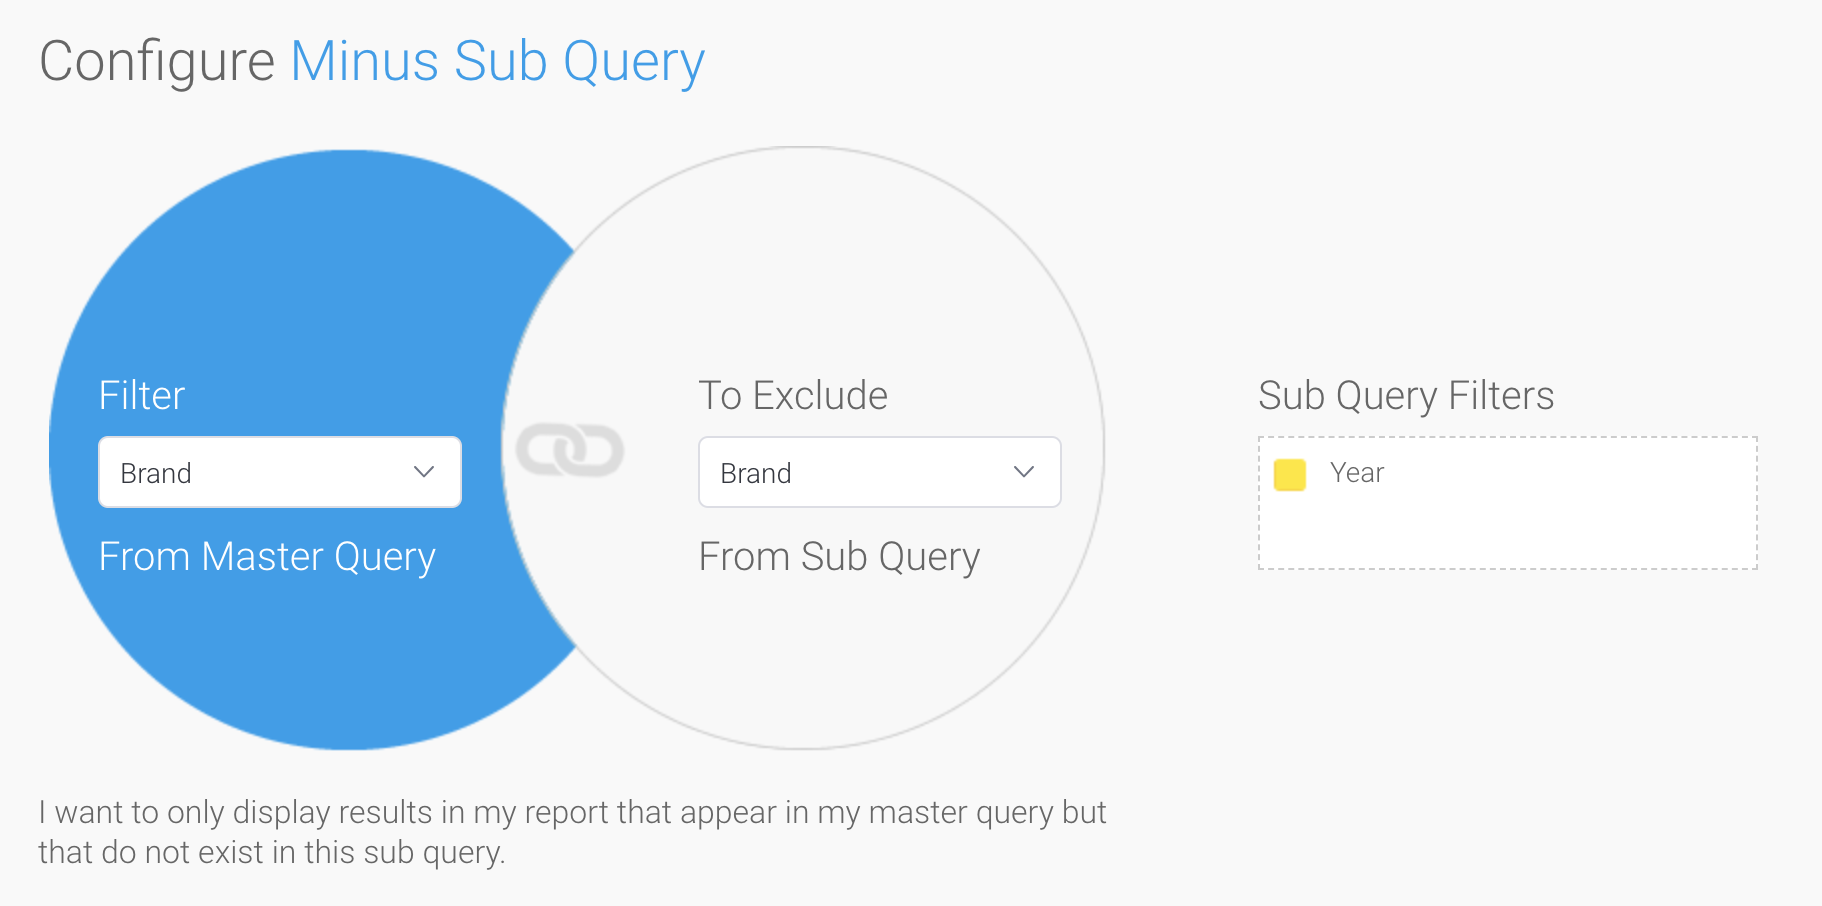
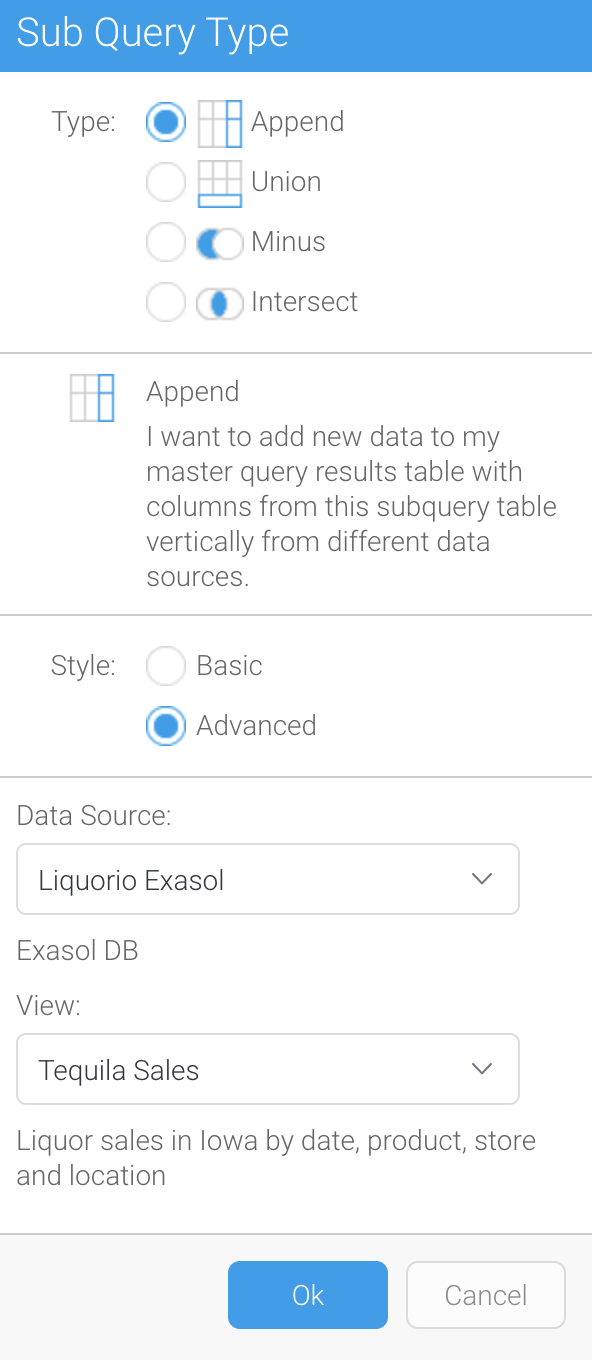
Or as a more complex example, we might like to report on brands that had no sales last year but had sales this year, this can be achieved using a MINUS subquery.
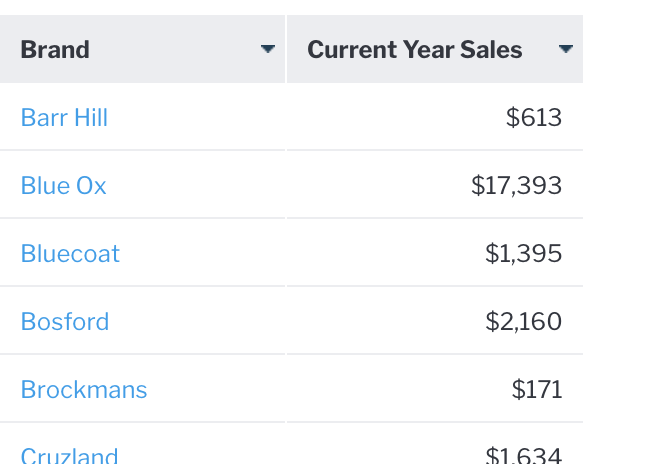
Note that the only brands appearing are the ones with no date for the prior year.
It is also possible to create a report showing Brands where there are Sales in both years, using an INTERSECT subquery, or to create a classic UNION query, whereby the results of two queries are appended to each other.
Joining data across data sets with Advanced Subqueries
Each subquery type can be either a Basic Subquery, where the data is sourced from the same View; or an Advanced Subquery. Advanced Subqueries have the ability to source their data from a different View to the parent query. This View can source data from an entirely different data source. So you could combine Sales data with HR data with data about the Sales person, from a different database.
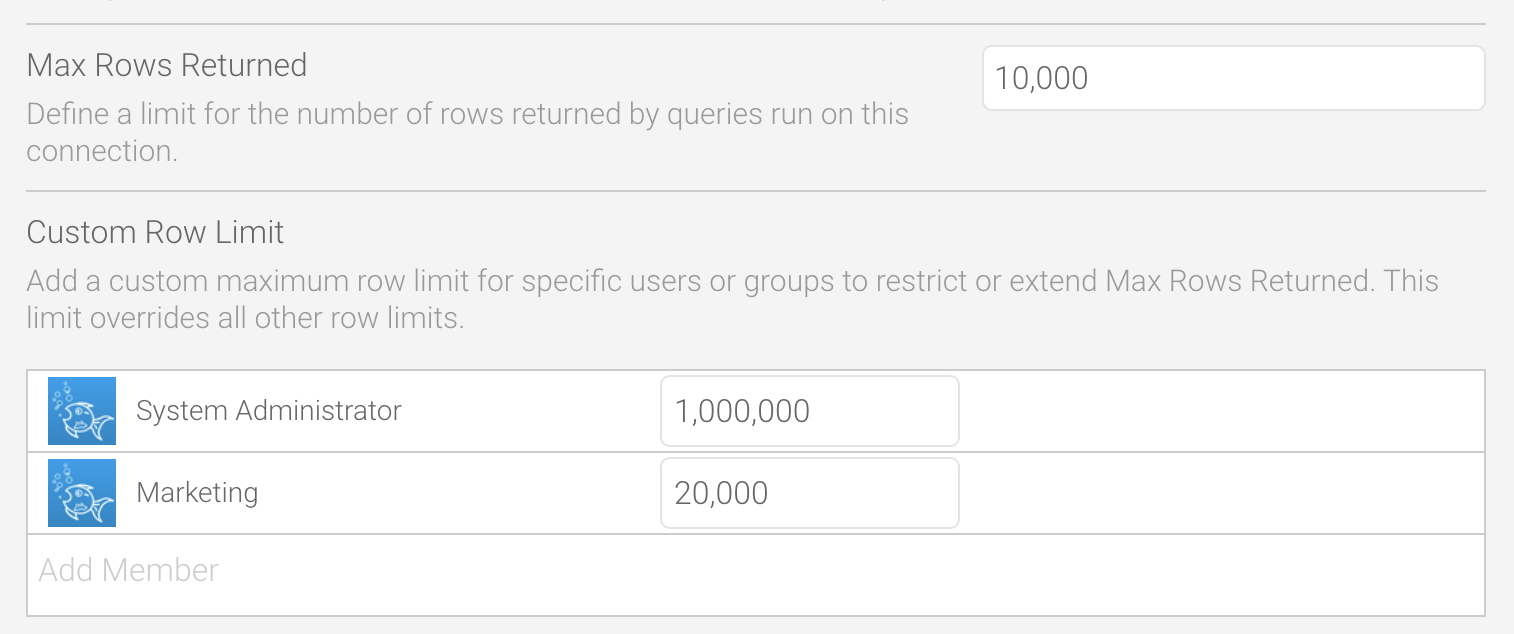
Protecting your system from overload
If your database is very large, it is possible for a user to create a query that can be time consuming, and in the case of SaaS DBMS, expensive. Yellowfin has multiple safeguards to protect the system from large query execution. Row limits can be configured at the data source level, and these can be varied by individual. So experienced users could have a larger row limit, and less experienced users a more restrictive row limit.
During the report build process, the query row limit can be configured dynamically, or automatic query refresh turned off - in which case sample data is used, enabling the report to be built very quickly and the query only executed upon request.
Getting a head-start with Guided NLQ
Yellowfin’s Guided NLQ (Natural Language Query) feature allows analytics users to build reports by typing a question. Unlike other NLQ implementations, Guided NLQ steps the user through a variety of possible options, making the question process simpler.
Whilst NLQ is aimed at lesser experienced users, it can also be used by experienced report builders as a fast way to start building a complex report. For example, rather than manually building an advanced subquery to find Brands with Sales this year but not last year, the following could be typed into Guided NLQ:
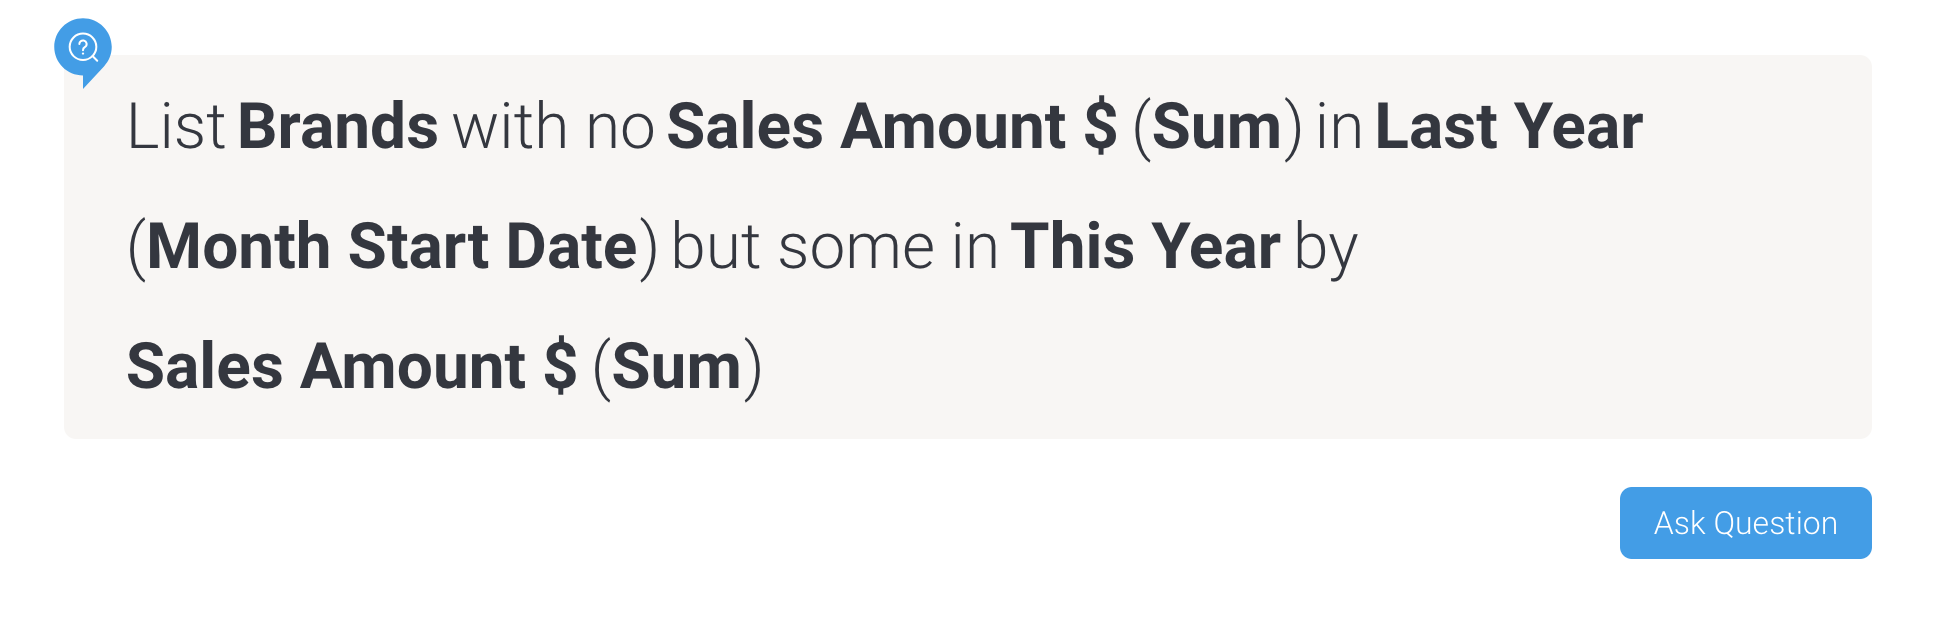
Yellowfin will then generate the following report:
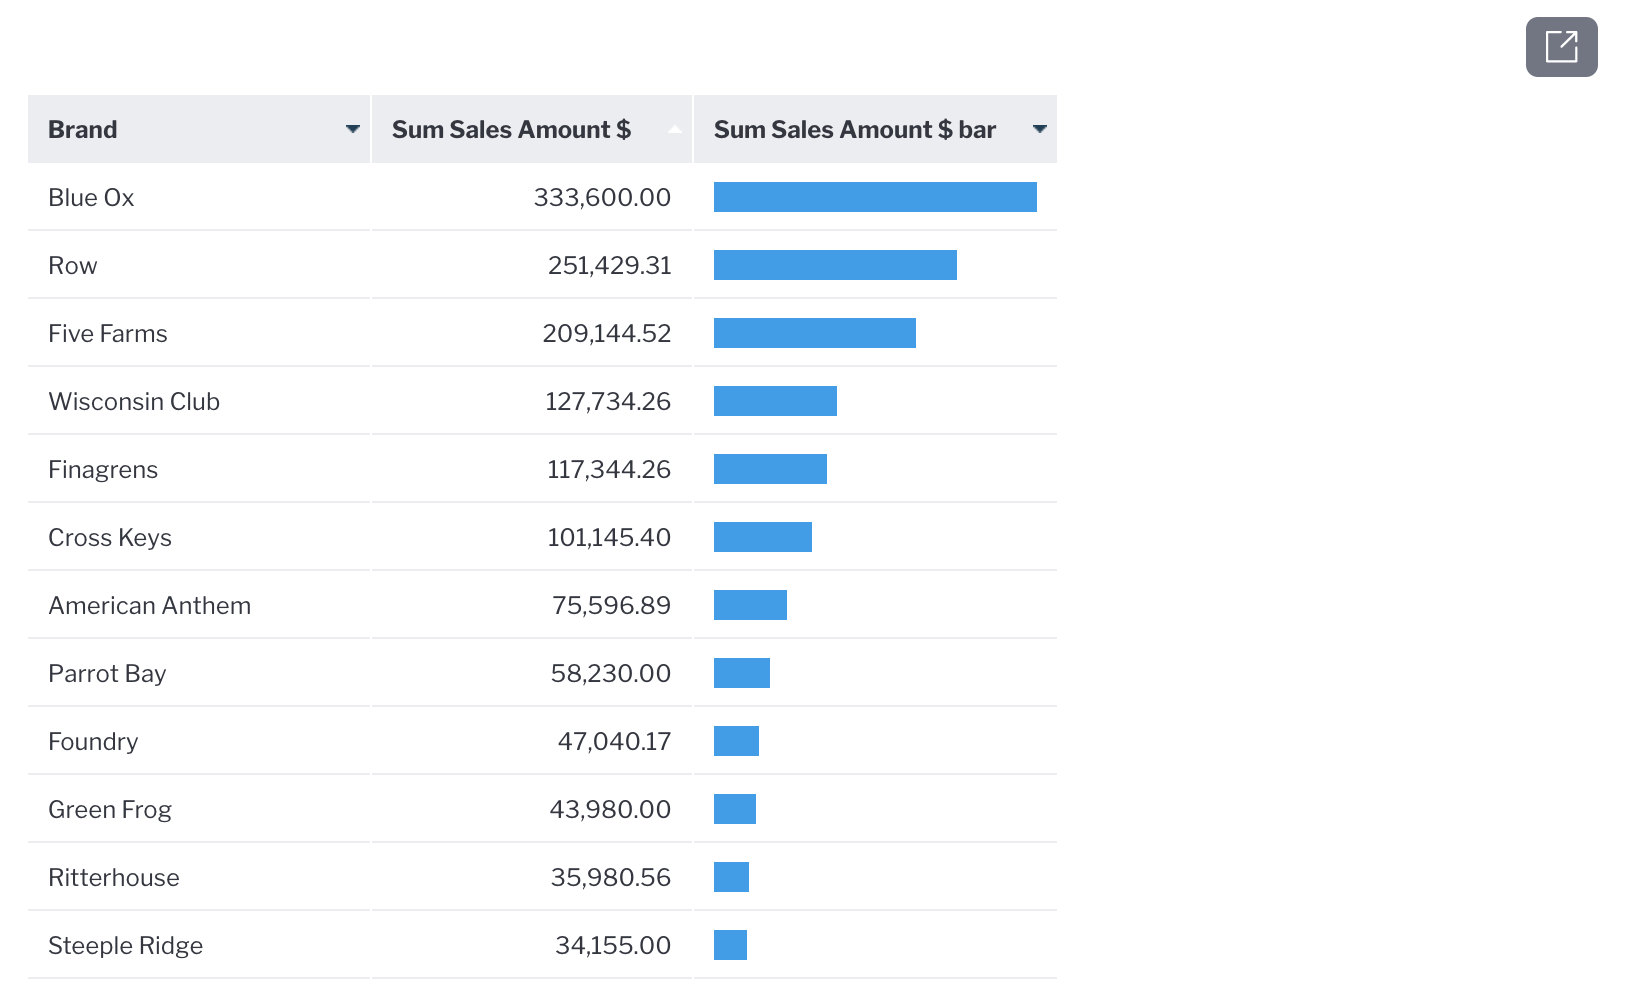
Behind the scenes, a full blown report has been created - the user can open this report by clicking on the arrow in the top right corner. This will launch the Report Builder with the fully defined report, inclusive of field formatting, subqueries, charts and more. This report can be used as per any normal report built using simple drag and drop.
Other Cool Features in Yellowfin
Enjoy the deep dive? In future blogs, we will explore more complex reporting topics including the ability to create Advanced Calculations in a report. These are executed on the final result set - enabling calculations such as mode and standard deviation as well as many other complex mathematical, statistical and formatting functions.
We will also start exploring charts, from basic to advanced concepts including chart functions (such as forecasting) as well as set analysis, to help you get the most out of your Yellowfin deployment.
Discover Yellowfin Guided NLQ
Interested in how Yellowfin Guided NLQ works? Get familiarized with all of our features today with our free guides, or get in touch directly with our Sales team.