

Yellowfin Guided NLQ vs Tableau Ask Data: What's the Difference?
When it comes to choosing a business intelligence (BI) solution vendor for your business, there are a variety of factors to consider. One important area of comparison is the natural language query (NLQ) features offered by different BI vendors.
NLQ is increasingly becoming a key capability of the modern self-service analytics experience, as it allows users to ask complex questions of their data, and receive insightful answers in the form of a pre-generated, best practice data visualizations. More importantly, it is a tool both non-technical users and data experts can leverage.
Yellowfin and Tableau each offer a unique approach to NLQ functionality to the market. This blog series covers the differences between Yellowfin and other NLQ competitors.
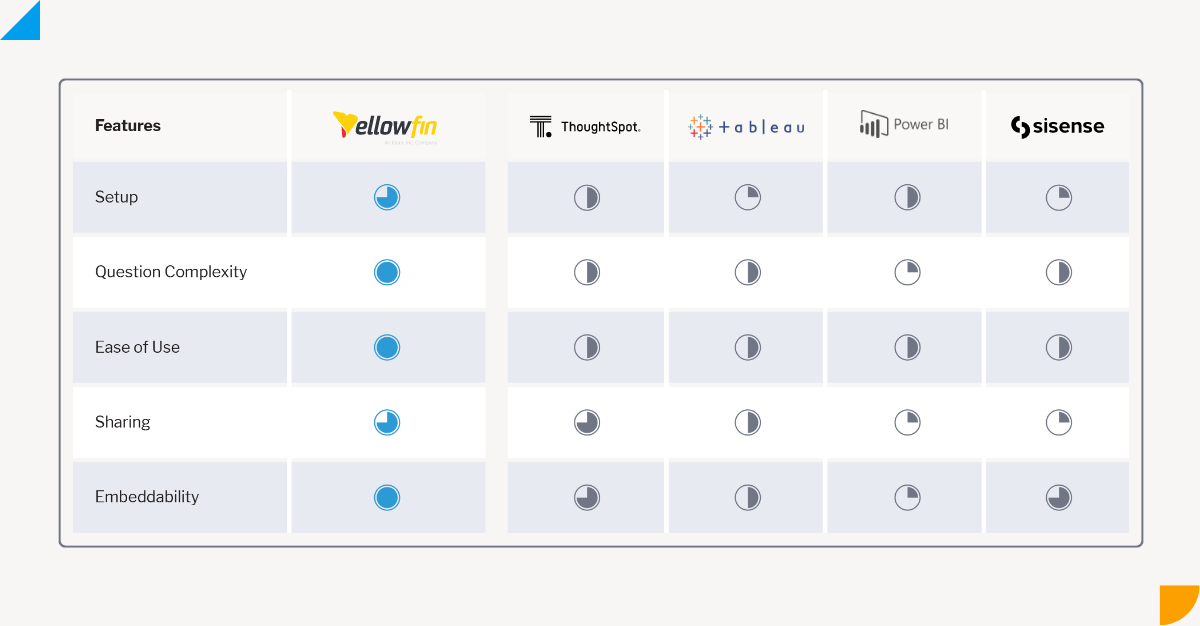
A comparison summary of Yellowfin Guided NLQ vs competitor NLQ tools.
Natural Language Query: An Overview
Natural language query (NLQ) is an analytics tool powered by artificial intelligence (AI) and machine learning (ML) technologies that is revolutionizing the way we interact with data. With the use of NLQ, users can access data and generate reports more easily, by asking a question via text-based input and receiving answers in plain English, rather than having to use coding language or technical jargon to write basic and/or complex data queries. This technology provides relevant insights and suggestions as the user builds their question, making it easier to identify trends in data, and follow data analysis best practices. For beginners, natural language query can be a game-changer, as it eliminates the need to have a technical understanding of programming or data analysis tools, and offers an intuitive way of interacting with data to quickly obtain the information needed while minimizing the time spent on overall data analysis. NLQ is beneficial for experts too, as they can leverage such a tool to rapidly generate answers to their complex data questions, and build upon the generated results. Read more: What is natural language query (NLQ)? An ExplainerWhat is Yellowfin Guided NLQ?
Guided Natural Language Query, or Guided NLQ, is a NLQ tool unique to Yellowfin that enables users to take advantage of fully guided self-service analytics reporting. Guided NLQ is powered by machine learning and automation technology to help assist both non-technical users and data experts to build a data question, based on pre-built parameters that the system automatically generates as they type in their question. It then generates an answer in the form of a data visualization or report, which can be built upon further and used in a custom dashboard or report. What makes Guided NLQ different from other tools is the querying process is fully-guided. The system is designed to eliminate the complexity and technical jargon required with traditional data NLQ tools by taking users through exactly how to ask a question of their data, without having to learn or know how to ask a specific data query beforehand. It does this by dynamically (through automation) providing users with detailed, guided pop-up suggestions and recommendations as they type, so users can refine and modify their queries in real-time, making it easier to find the answers they need. Basic question types with Guided NLQ are pre-configured into the system, allowing beginners to leverage suggestions and quickly learn how to build complex questions.
Guided NLQ also leverages contextual information, such as user preferences and historical usage patterns, to provide personalized recommendations as the user types their question. This helps to further streamline the data querying process, and improve the accuracy of the results.
Overall, Guided NLQ is a powerful tool that is transforming the way users interact with data. By enabling users to harness the power of natural language, this technology is making data analysis more accessible, intuitive, and efficient for businesses of all sizes. With Guided NLQ, Yellowfin aims to democratize data analysis for all, and help more people make data-driven decisions.
Learn more: An introduction to Yellowfin Guided NLQ: What is it?
 Yellowfin is built on the philosophy that data must be good quality and well structured, backed by a robust and comprehensive meta-data model, and this extends to how Guided NLQ works. Because a View is a mandatory step that must be configured by the business prior to users engaging in any data analysis, it ensures consistency and trust in the data, and can be reused by all.
Once set up, your users are not prompted (and do not need) to tinker constantly with meta-data layer settings they may or may not understand - they can simply get started with querying their data immediately. Other BI tools do not require the use of a meta-data layer, and therefore the process of setting up the data to enable NLQ can be more complex and time-consuming.
Yellowfin is built on the philosophy that data must be good quality and well structured, backed by a robust and comprehensive meta-data model, and this extends to how Guided NLQ works. Because a View is a mandatory step that must be configured by the business prior to users engaging in any data analysis, it ensures consistency and trust in the data, and can be reused by all.
Once set up, your users are not prompted (and do not need) to tinker constantly with meta-data layer settings they may or may not understand - they can simply get started with querying their data immediately. Other BI tools do not require the use of a meta-data layer, and therefore the process of setting up the data to enable NLQ can be more complex and time-consuming.
What is Tableau Ask Data?
Ask Data is a NLQ tool unique to Tableau which allows users to ask questions using natural language, and receive answers in the form of interactive visualizations. Similar to Guided NLQ, it is a tool targeting line-of-business users who want to explore their data, but may not have prior knowledge of the underlying data structure or experience with how natural language query works. Ask Data uses machine learning (ML) to understand the user’s intent and context of the question, and to automatically build and recommend the most relevant visualization, which the user can build upon with some small configurations, such as changing the chart type. It can also be used to modify existing visualizations and data sources, as well as combine data sources from multiple datasets. Learn more: How Yellowfin Complements Tableau to Expand Analytics Use CasesYellowfin Guided NLQ vs Tableau: Setup
There are some key differences in the setup required to utilize Guided NLQ and Ask Data.Yellowfin NLQ Setup Process
In Yellowfin, a View is always required before any content can be created; for example, a report or a natural language query. A Yellowfin View is a metadata layer that sits between the Source Connection (where your data comes from) and the Report Builder (reports). This layer contains all of the necessary information about the data from which reports are to be built, including calculated fields, data formatting, join conditions, table structures, and so on, and specifies the fields and logic required for users to begin building any reports. It defines the relationships and logic between tables, identifies fields to be accessed by report writers, and specifies default formatting for these fields. A report writer will use the relationships and fields defined in the View to base their reports on, without having to understand the underlying technical logic.
Yellowfin is built on the philosophy that data must be good quality and well structured, backed by a robust and comprehensive meta-data model, and this extends to how Guided NLQ works. Because a View is a mandatory step that must be configured by the business prior to users engaging in any data analysis, it ensures consistency and trust in the data, and can be reused by all.
Once set up, your users are not prompted (and do not need) to tinker constantly with meta-data layer settings they may or may not understand - they can simply get started with querying their data immediately. Other BI tools do not require the use of a meta-data layer, and therefore the process of setting up the data to enable NLQ can be more complex and time-consuming.
Tableau NLQ Setup Process
In Tableau, configuring a meta-data layer is optional for other features, but it is required for Ask Data. A Tableau Author is required to pre-configure a Lens for users to be able to query a data source with Ask Data. A Lens is akin to a view in Yellowfin, a subject area of data relevant to a specific set of users or questions. Within the Ask Data Lens sits synonyms for field names and values relevant to the intended audience’s job function, recommended visualizations, and so on. If a Lens isn’t manually set up for each dataset before the user wants to run a query via the Ask Data tool, they will be prompted to create a Lens to use Ask Data. The user can proceed with configuring a Lens themselves to select a list of search fields before they can start with analysis. Tableau recommends heavy curation of data sources beforehand by a data analyst for Ask Data to work effectively for regular users and begin answering their questions, as well as feel natural to use for beginners.Yellowfin Guided NLQ vs Tableau: User Interface
Most natural language query offerings present the user with a blank toolbar, and prompts them to start typing. The challenge with this user interface is if the analytics user has no idea of what they are looking for, or how to articulate a data question, or what syntax to use that the NLQ tool supports, they won’t know how to get any value out of the tool, and may not use it altogether. Guided NLQ and Tableau approach this user experience challenge in different ways.Yellowfin NLQ User Experience
Guided NLQ provides step-by-step guidance for novice users while giving experienced users the freedom to type what they know. Every user can type a question and receive dynamic popup suggestions for a fully guided experience to structuring the right type of question for the answer being sought after. Before the user types anything, the Guided NLQ user interface immediately presents contextual guidance in the form of a drop-down menu, with suggestions for the type of question a user may want to ask. If the user begins to type a question, the engine provides an auto-complete suggestion that immediately locks onto the field that you may want to select. This means Guided NLQ does not need to be trained on synonyms or guess intent; it gets it right every time, as the engine draws from the meta-data layer (the Yellowfin View being queried).
The contextual guidance menu is shown at every step of building the question, and there is an additional button that provides tips on what to look out for if the question seems incomplete (for example, if the user fails to specify a time period on the data they want to query). Because basic question types are pre-configured into the system, first time users can easily navigate a series of suggestions to learn how to build complex questions fast, while advanced users can use the tab key to auto-complete partially typed terms.
Once the query is built in Guided NLQ, the user is presented with an answer in the form of a data visualization, such as a chart or graph (it can be changed to be displayed in tabular form). The user can go back to edit the question at any time to delete or modify the query to quickly get a new answer, ask a new question, or change the data View to ask questions on different parts of your business data, all without leaving the UI.
All generated answers can be taken straight into a new report in a single click to continue exploration in the Advanced Report Builder (ideal for experts), added to existing content (dashboards, Stories, Presentations) or saved for use later.
Tableau NLQ User Experience
The Ask Data user interface is a standard question bar that a user types into, with suggestions dynamically generated as a drop down menu from the question bar. In addition, more suggestions are generated below the question bar, which users can click on. These are then added to the question syntax. As users complete a recognizable fragment of a query, Tableau adds it to an area above the question bar that is split into fields and filters (Tableau’s interpretation of what you have typed). Superfluous words are stripped out and only the query elements remain in the top section. You can also add fields and filters by clicking the + button in the upper section, thus using the UI to build out the query. You can also change the visualization type using a drop down menu.
Clicking on a field or filter shows a drop down where changes can be made; for example, change the aggregation type for a metric, change filter values or filter definition (ranges, date periods, wildcards), and so on.
If a Lens is not sorted out prior to the user typing a question in Ask Data, the user is prompted by Tableau to ‘Create a Lens to Use Ask Data’. This involves manually configuring the data source (Lens) before being able to query the dataset, which presents a challenge in that the role of the data source owner is thrusted upon the user (who may or may not have data analysis experience) who cannot get their data needs immediately answered to without this friction.
If the user proceeds to create a new Lens, they are taken into a different window where fields must be selected before proceeding with the query and further analysis. Once a specific question is entered by the user, the page refreshes to display a visualization to answer the query, and a list of suggested items that are intended to explain what the user is seeing. The natural language used in the original question, however, is removed, leaving the user to explore the suggestions from Ask Data to better understand Tableau’s explanation for the generated results.
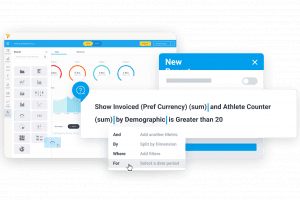 Tableau provides an embed code icon next to a completed viz in Ask Data. Users can embed this code in a web page, and it will launch Ask Data. However, no question will be loaded. Users can then interact with Ask Data as they would in Tableau.
Yellowfin Guided NLQ vs Tableau: Question Complexity
After the user interface, the most challenging factor for users of natural language query solutions is the complexity of questions that can be asked. As writers of SQL will be familiar with, a simple question can often-times result in a highly complex query.Yellowfin NLQ Question Building
Guided NLQ has a rich query generation engine, with virtually any SQL query able to be generated, including complex calculations, sub-queries, and post-query result set merging of disparate data sources. Yellowfin’s drag and drop interface makes the presentation of the complexity of query building accessible and usable for a wider range of analytics users. Guided NLQ has an internal API that sits on top of its query engine, so any query can be automatically generated programmatically. Many business questions were grouped into question types, and mapped to this API, allowing for query complexity that is not currently matched by any of our competitors. See a full list of question types supported by Yellowfin in our accompanying article, ‘Not All Natural Language Query (NLQ) Models Are Created Equal’.Tableau NLQ Question Building
Ask Data supports a range of question phrases, including aggregations (standard - average, min, max, sum, count, etc), Group (by keyword), Sorting and Filters (numerical - at least, at most, between, categorical, dates, etc) and time filtering (previous, last, following, between, starting at, ending at, etc). Ask Data lets you compare differences over time using the month over month or year over year keywords, and these keywords automatically create a difference or percentage difference calculation. You can also perform simple arithmetic calculations by directly typing the formula in the Ask Data query search box.Yellowfin Guided NLQ vs Tableau: Sharing
Guided NLQ can be accessed anywhere in the Yellowfin platform; dashboards, reports, Stories, Presentations and the Create Menu. Queries generated by Guided NLQ can be added directly to these content types, as well as being opened in the Advanced Report builder and treated like any other Yellowfin content - whereby they can be modified, scheduled and shared with other users. Ask Data allows users to press enter at any time to create a ‘viz’ (visualization) and click the share button to share it via email or Slack, or copy a shareable URL. Any Viz created in Ask Data can be added to a workbook using the Save button.Yellowfin Guided NLQ vs Tableau: Embeddability
Embedded analytics integrates analytics into the direct workflow of the end-user, providing them with the contextual data they may require to make a decision or complete their work, without the need to move to another application window just to source relevant information. Yellowfin has APIs that enable individual content items like Dashboards or Reports to be embedded into a third-party application or website, or even parts of or the whole Yellowfin user interface. Guided NLQ’s search bar can be embedded just like any other content type by implementing a simple embed link into your application, or an advanced API for more fine-grained control.
Tableau provides an embed code icon next to a completed viz in Ask Data. Users can embed this code in a web page, and it will launch Ask Data. However, no question will be loaded. Users can then interact with Ask Data as they would in Tableau.