

How data storytelling and augmented analytics are shaping the future of BI together
While the AI and automation capabilities of augmented analytics dominate today’s business intelligence (BI) conversations, data storytelling is fast becoming a hot topic - and together, they’re set to re-shape the future of BI.
The 2021 Gartner Analytics & Business Intelligence Platforms Magic Quadrant Insights Webinars poll recently revealed 25% of leaders view data storytelling one of the most important, emerging capabilities to have when selecting a new analytics solution.
It’s the second highest result, behind automated insights at 44%, showing businesses want to be able to communicate insight and context from data using stories, and that narrative is as important as the AI capabilities that make up augmented analytics.
In fact, Gartner predicts data stories, not dashboards, to be the most widespread way of consuming analytics by 2025. But interestingly, 75% of said stories are predicted to be automatically generated rather than human-made, using augmented analytics tools.
Yellowfin has been big on data storytelling since day one, and as we’ve covered, data storytelling is a human-driven practice still in the midst of realizing mass adoption. So, what does this bold prediction of automated data storytelling mean for the future of BI?

The business case for augmented, automated data storytelling
Put simply, because augmented analytics features are now increasingly provided in today's BI tools, there is more expectation software can be taught to generate and share relevant data stories to its end-users, by automating aspects of the narrative process.
But as it exists today, data storytelling is entirely led by the user. It’s the manual practice of combining narrative with data to deliver insights in a compelling form to assist decision-makers in engaging with data and analytics. A story backed by data is more easily consumed and understood than a dashboard, which can overwhelm with numbers.
Where data storytelling and augmented analytics intersect is in the rise of the augmented consumer. It’s a growing trend that describes a mindset shift away from BI solutions catering to the analyst toward the regular professional, who needs easier and faster data-led insights.
Tools such as AI and natural language are now designed in a streamlined way to guide people in understanding what their data means and how to act on it, instead of expecting them to do self-service analysis with dashboards and charts and know what to do next.
The benefits of augmented analytics is to help non-technical people use enhanced analysis techniques without needing expert knowledge, reducing reliance on experts and time spent exploring data. This line of thinking is now being extended to data storytelling: If I can’t or don't have time to make a data-led story, why can’t the AI do it for me?

The purpose of automating and augmenting data-led stories
While still looked to as a future capability, automated data storytelling is gaining attention due to its ability to solve three challenges of data storytelling, as it exists today:
Problem #1 - Telling stories on more than just the insights noticed by people: Creating a data story generally starts with finding a problem or opportunity in a dashboard or visualization, and then exploring, narrating and sharing it with others in the form of a story. However, what one person finds an interesting anomaly or relevant insight, another might ignore or miss entirely. Avoiding the pitfalls of human bias, such as attentional or confirmation bias, when sharing insight requires experience and awareness not everyone has, and it may make quality data storytelling a slow or sporadic practice.
Problem # 2 - Data literacy and the limitations of manual self-service: In the current paradigm of self-service BI, telling a good data story is reliant on the users’ ability to serve themselves. But why doesn't that always work? Because everyone has different data literacy (or data fluency) levels, so not everyone can make it work. For example, Jane or John from Human Resources might have trouble manipulating data and doing visual analysis just to find out what the trends in HR data are, limiting their ability to create a data story altogether.
Problem # 3 - Scaling data storytelling across the business: Because storytelling with data is a manual, human-led technique, realistically scaling it across a business is an open question, especially because it’s still an analytical skill set many organizations are only now recognizing and prioritizing. In the mean-time, analysts can’t be expected to always find and extract meaningful stories in big datasets in a timely fashion, and regular professionals may be busy dealing with normal business operations to spend much time consuming and then communicating insights in narrative form for everyone’s benefit.
As explored by industry advisory leaders such as Gartner, there are many ways combining data storytelling with augmented analytics could help reduce or eliminate these challenges.
- Solution #1 - Augmented analytics, through AI, machine learning and natural language algorithms, analyzes business data in a way that side-steps human biases when exploring a data set, so extending this with a data storytelling module could help generate helpful data-led narratives that may be missed, overlooked or undervalued when created by people.
- Solution #2 - Automated business monitoring and automated analytics, meanwhile, could extend past its monitoring and alerting capabilities and use automation to generate stories at scale, giving analysts and professionals more time for their workflow and less on exploring data.
- Solution #3 - Augmented analytics can take much of the pressure off end-users’ shoulders by automating common and complex self-service BI processes, such as mashing datasets together, and side-step the requirement for high data literacy altogether by generating stories based on detected problems and opportunities in the widest possible dataset.
Of course, actually having a working version of automated data storytelling, or augmented data stories generated from AI, is dependent on BI software itself being able to apply these technologies and generate stories in a way that does not seem too algorithmic to the reader, while appealing to the average audience.
The emotion we put into our stories, whether it’s personal interpretation or celebration of an achievement or expert opinion, is a big part of telling data-led stories that inspire and help people make decisions, and it’s not something technology can easily replicate.
For now, at least, that leap in technology is still a while away. However, there are some current-day examples of AI storytelling that can provide a glimpse into what’s possible.
3 examples of augmented analytics combined with data storytelling
Yellowfin already uses augmented analytics techniques, including statistical algorithms and natural language generation (NLG) to generate text-based explanations or comparisons of data that help people understand what’s on a chart or dashboard, lessening the level of interpretation needed on the part of a user, an example of this being our dedicated Assisted Insights feature.
![]()
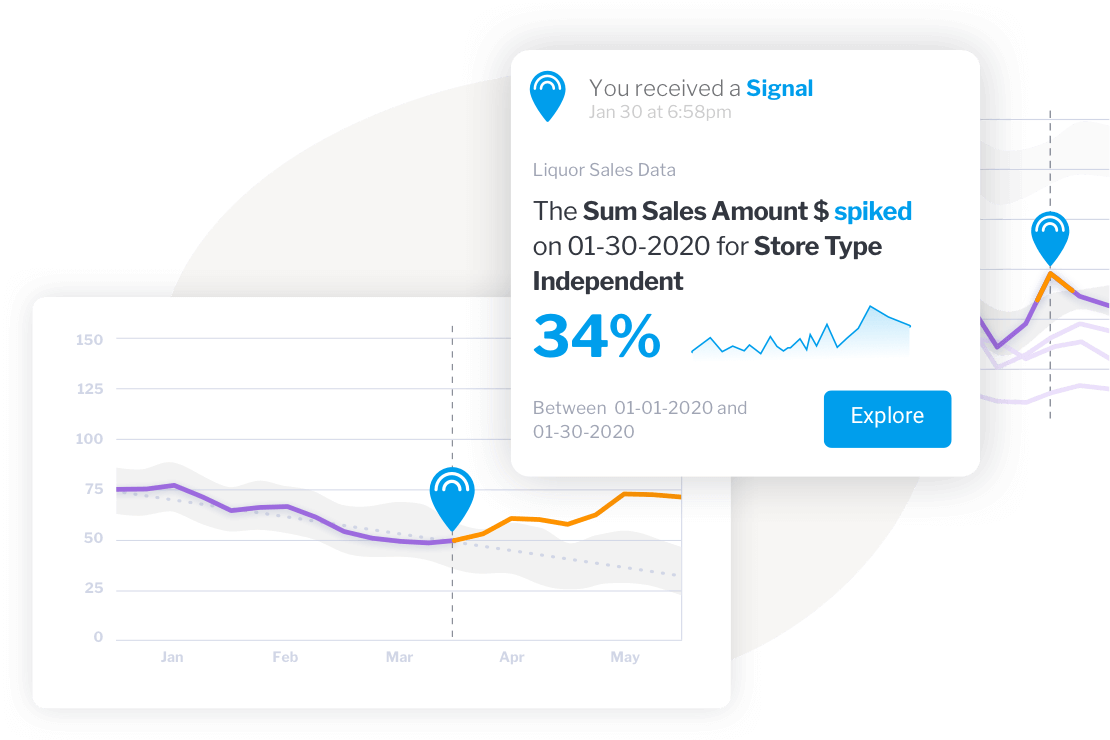
Yellowfin also continually monitors and detects patterns or outliers in data without the need for constant manual process, and generating headline-based alerts to help users become aware of important discoveries, which is achieved in our ABM product, Signals.
Assisted Insights and Signals allow for large amounts of complex data to be found and analyzed faster than what is manually possible, and insights from data can be communicated in a way not influenced by human bias. Together with Stories and Present, Yellowfin’s dedicated data storytelling modules, a user can find problems and opportunities in data faster, and create stories from those automated results using the power of data, words and rich media. But as it stands today, data storytelling is still very much shouldered by the individual, not the machine.

Read more: 5 Yellowfin Stories features that change how data flows through your organization
Data storytelling and the future of analytics: Key takeaways
While results generated by algorithms are not comparable to the types of narratives humans create, they can help guide you on your journey toward discovering and understanding an insight in data, and in potentially creating a story from it.
In this way, it’s easy to see why industry experts predict the combination of data storytelling with augmented and automated techniques; these capabilities are more than capable of generating and automating parts of a data story’s creation for a layperson.
Ultimately, being able to understand how to translate emotion, tropes, personal interpretation and experience, and how to tell what’s most relevant to each user, is the next frontier for augmented and automated analytics providers to solve. However, it’s clear automated and augmented data storytelling is not that far away, and recognizing these capabilities early could mean you’re better prepared for when they’re available.
Whitepaper: Data Storytelling - The Power of Using Narrative to Influence and Engage the Business
Demystify the conversation around data storytelling, and understand its usefulness for all types of analytics users in our free whitepaper today.