Yellowfin Evaluation Guide
Yellowfin is used for both enterprise analytics and embedded analytics use cases and for building bespoke analytical applications. Use this guide to ensure Yellowfin is the right technical fit for your requirements.

Automated Analysis & Monitoring
-
Automated Analysis & Monitoring
Updated 20 September 2024What is Automated analytics?
Automated analytics is a process whereby machines are used to automatically analyze data looking for significant changes in data instead of traditional manual data discovery methods. Analysis tends to be time-series based and centered on key changes such as finding changes in total and average, trend direction, volatility, step shifts and outliers (spikes and drops).
Typically these processes augment traditional methods such as dashboards and reports providing a richer analytics experience for end users.
How does Yellowfin help me to automatically analyze and understand what is happening in my data?
Yellowfin has developed advanced machine learning capabilities that assist users in the discovery and interpretation of data insights. These capabilities augment the capabilities of the user and enable them to analyze more data, find more insights and understand root cause – far faster than a human alone ever could.
How does Yellowfin help me to ensure I do not miss critical changes in my data?
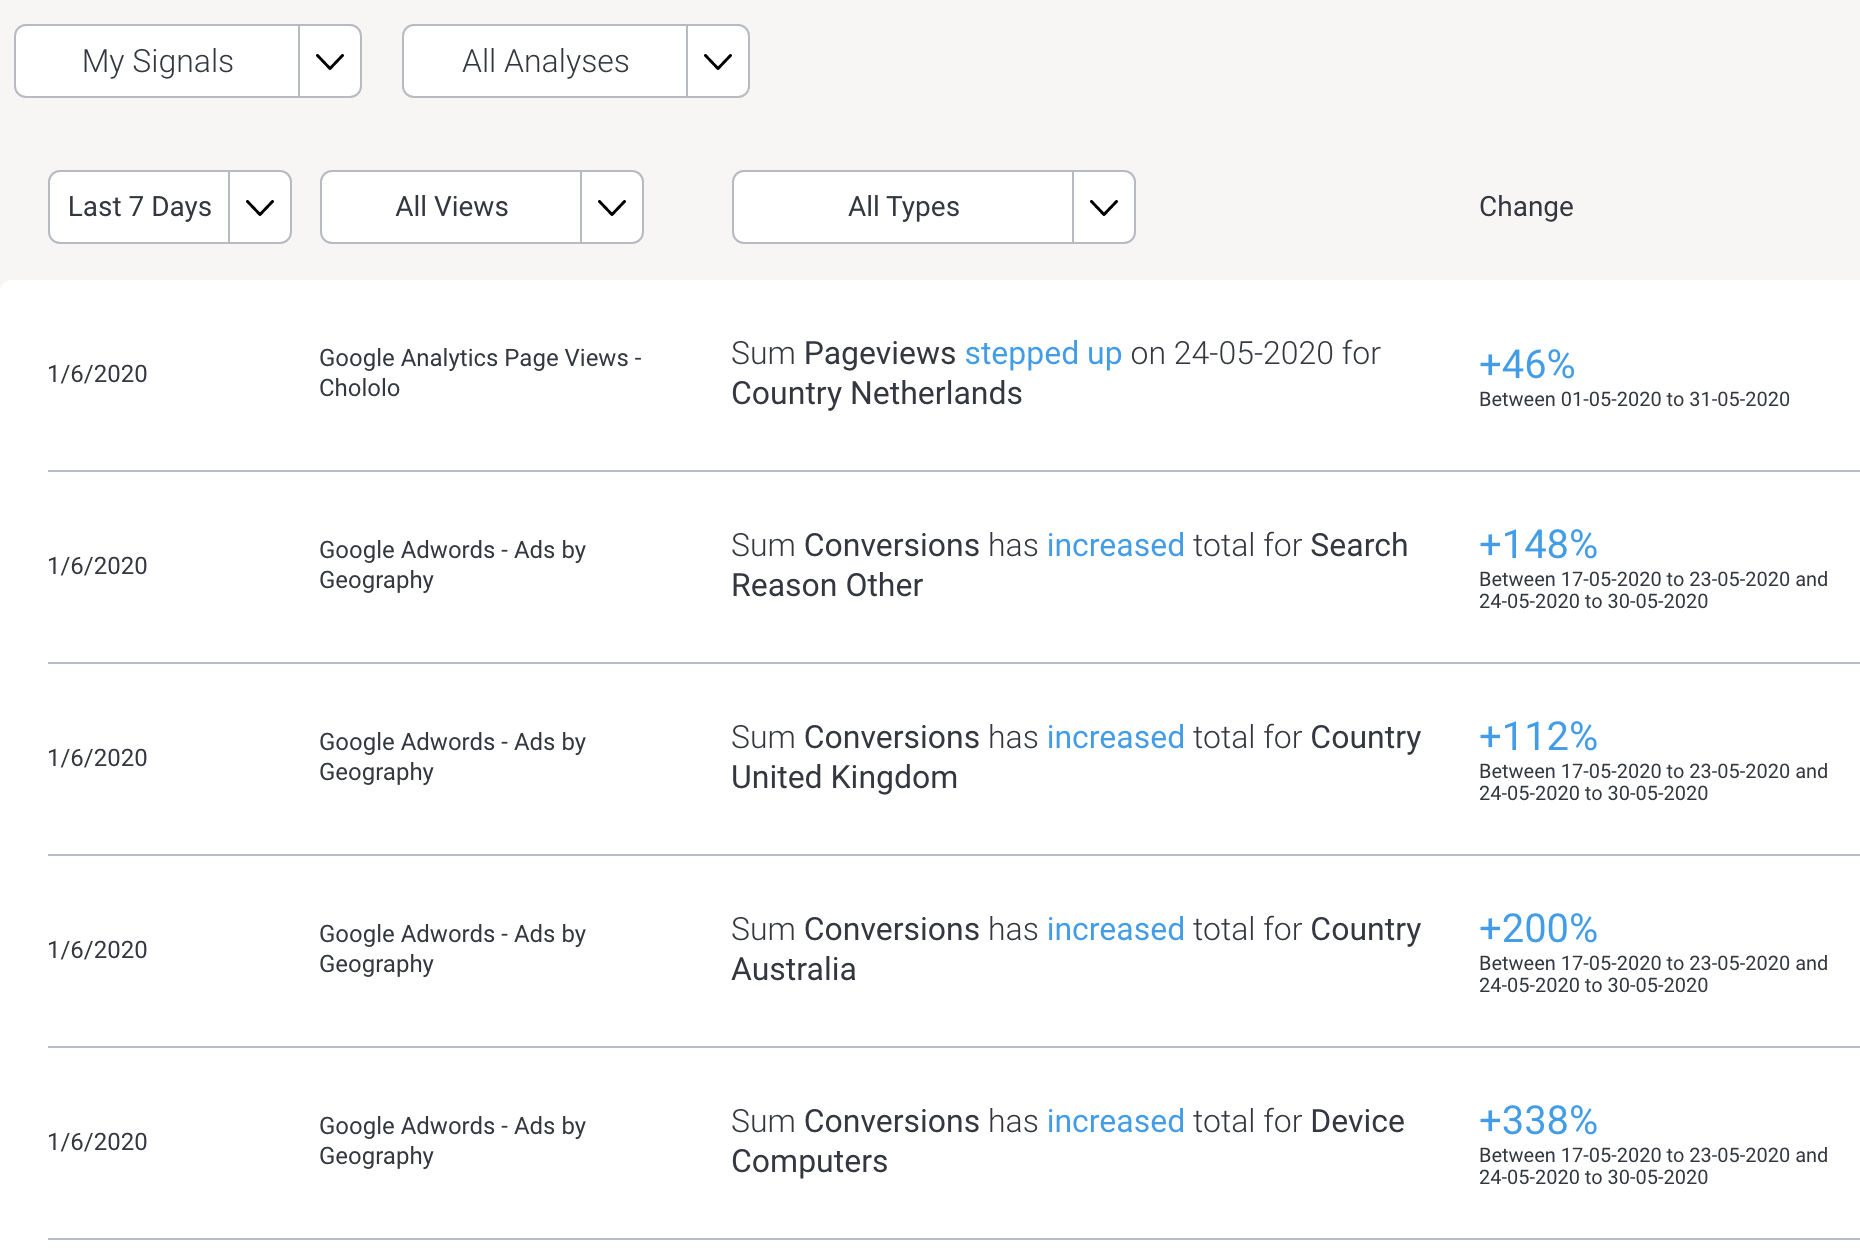
Yellowfin Signals can be used to automate the process of discovering important insights in your data. Signals leverages the meta-data layer and can be easily configured to continually scan your data, identify changes that exceed thresholds, and create personalized notifications to your users.
Signals deploys a variety of complex algorithms aimed at detecting interesting and relevant changes in your data. This includes changes in total and average, trend direction, volatility, step shifts and outliers (spikes and drops). Signals algorithms can automatically detect and allow for natural seasonal variation in data. Signals setup is simple, however if required, fine-grained configuration of thresholds and algorithm parameters is available if desired.
Signals can be configured to simultaneously monitor many metrics and across many dimensions – and thus scan and examine far more data than a human ever could. Signals deploys a complex ranking algorithm to determine the most relevant data events, and then further ranks the data for each individual user based on that user’s preferences and previous system usage. This ensures only the most relevant and important insights are alerted to the user.

What use cases should I use automated analysis for?
Signals can be used for any data that has one or more metrics, one or more dimensions, and is stored over time. Most data setup for Analysis purposes is set up in exactly this way, and as such Signals can be used for a huge variety of use cases. Here are just a few examples:-
- Changes in web-site traffic over time in order to understand the effectiveness of certain web-pages, campaigns and so on
- Comparing and analyzing changes in financial data between time periods (say year on year) – and understanding what are the underlying drivers of those changes. For example – which regions, products or segments are experiencing the biggest changes in revenue
- Tracking sales data from e-commerce sites to understand which products are improving and which are declining
- Analyzing the effectiveness over time of marketing campaigns on Lead generation
Monitoring hospital admission data to understand and spikes or drops across a health system network, and what the potential causes of that may be - And many more
On what frequency should my Signal jobs run?
Generally it makes sense to schedule the jobs to run immediately after the data is refreshed, that way you will be notified of any significant changes as soon as possible.
Signals jobs should be configured to run no more frequently that your data is refreshed. For example, if you are connecting to a Data Warehouse and the data is only refreshed weekly, there is no point scheduling the Signals jobs to run more frequently than that – Signals won’t find anything new as the data has not changed.How do I ensure that the Signals generated are relevant to an individual user?
There are a number of things that can be done when configuring a Signals job that will ensure only relevant Signals are generated, these include:-
- Ensure that only the most important dimensions and metrics are selected.
- Ensure the most appropriate time-periods are selected – for example, if it generally only makes sense to compare quarterly data for a particular metric – then it won’t make sense to run daily Signals on that data.
- Use Signal filtering to remove data that you do not want to generate Signals on. For example, you may be running Signals on website data, but you want to exclude support pages from the analysis to focus in on marketing prospects.
- Select the most appropriate Signal types – not every Signal type will be of interested to all users (for example, volatility may only be of interest to subset of your audience)
- Send notifications only to those users that will value receiving the Signal and where it is relevant to their role
- Ensure that appropriate thresholds are set – for example if your data is highly volatile to small changes, setting a low threshold will result in a lot of meaningless Signals being generated. Setting a higher threshold will ensure the most appropriate Signals are flagged
- Experiment with the Signals configuration until you find the right sweet spot for your data. Signals uses default configuration values for its algorithms that should suit most data – however these values can all be changed to suit particular needs. Often trial and error is required to find the right settings. Signals provides a simple interface for tuning parameters (a slider that can be changed to produce more or fewer signals) and also an advanced mode – where each parameter can be individually set. Signals jobs can be cleared and rerun, with the results exported to Excel so that comparisons can be made between each run in the training phase.
After a Signals job has run, the system uses a ranking algorithm to sort Signals of different types, so that the most important Signals are prioritized for delivery. In addition, the Signals algorithm looks at the preferences and behavior of individual users and will weight a Signal based on its potential usefulness to a user. Signals looks at the Signals that a user typically opens and interacts with, or has marked as useful – and then weights the attributes of those Signals more heavily in the ranking – dimensions, metrics and Signal type. The more a user uses Signals, the more information exists for the system to perform better ranking.
How do I understand the cause of a Signal?
The signals interface includes a range of analysis to help a user understand the cause of a specific Signal. This includes:
- The display of related metrics so that a user can overlay these and see correlations between them.
- Correlated Signals – other Signals that have been detected that share a similar pattern. These in combination may provide further insight; and
- Assisted Insights – automated root cause analysis on the data to identify what changed the most that may explain the Signal further.
What can I do with a Signal once I get it?
Signals can be notified via a timeline notification, email or via the Yellowfin mobile app. Once a Signal is delivered, Yellowfin provides additional information to assist the user in understanding the root cause of the data event – including identifying other highly correlated data events from the same or different data sources.
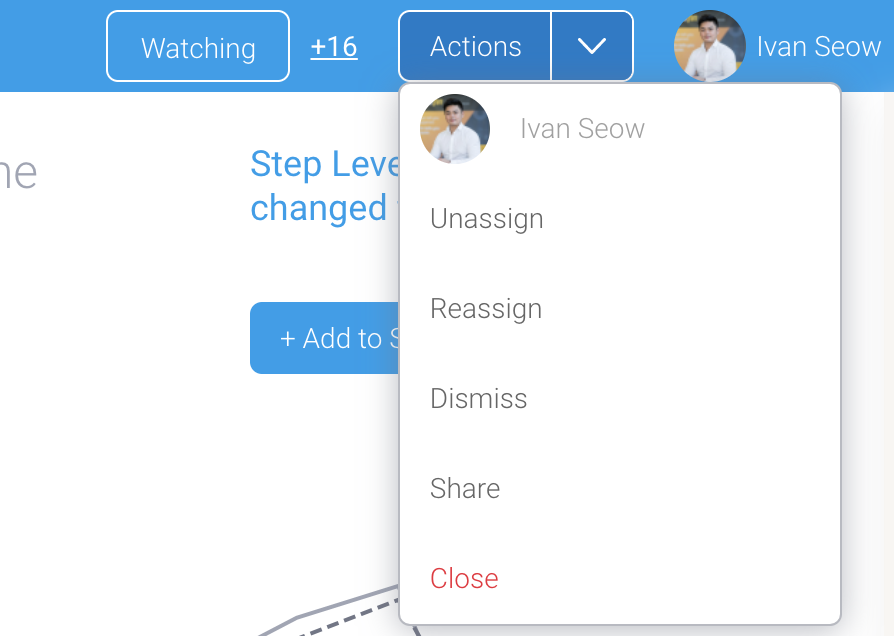
Collaboration features allow Signals to be shared, discussed, followed and added to Data Stories. The Signals workflow allows Signals to be assigned an owner, and managed via a workflow until a conclusion is reached and actions agreed.

How can I combine Signals output with my regular Dashboards?
A Signals Widget object is available in the Dashboard builder. The Signals widget can be connected to the output for a particular Signals job, and can be further configured to show specific signals from that job. For example – I could add a Signals widget to my Marketing Dashboard that was linked to Signals generated off web-site traffic data.
Users can click on any signal displayed in the widget, and open that signal for full exploration.How does Yellowfin Signals differ from alert based reporting?
Alert based reporting is typically set up on an individual report. Signals are set up to scan all of the data defined in a given view.
Alert based reporting typically has simplified rules – for example, comparing a single value to a defined threshold. Signals deploys a range of sophisticated algorithms designed to identify relevant changes in your data – including things like trend changes, volatility changes and outliers.Alert based reporting typically is designed as a rule that will decide whether to deliver a specific report or not. Signals are ranked and personalized for each user in a system, and when delivered provide a wide-variety of system generated output aimed at assisting the user in understanding why a particular data event may have occurred.
Can I create threshold based alerts?
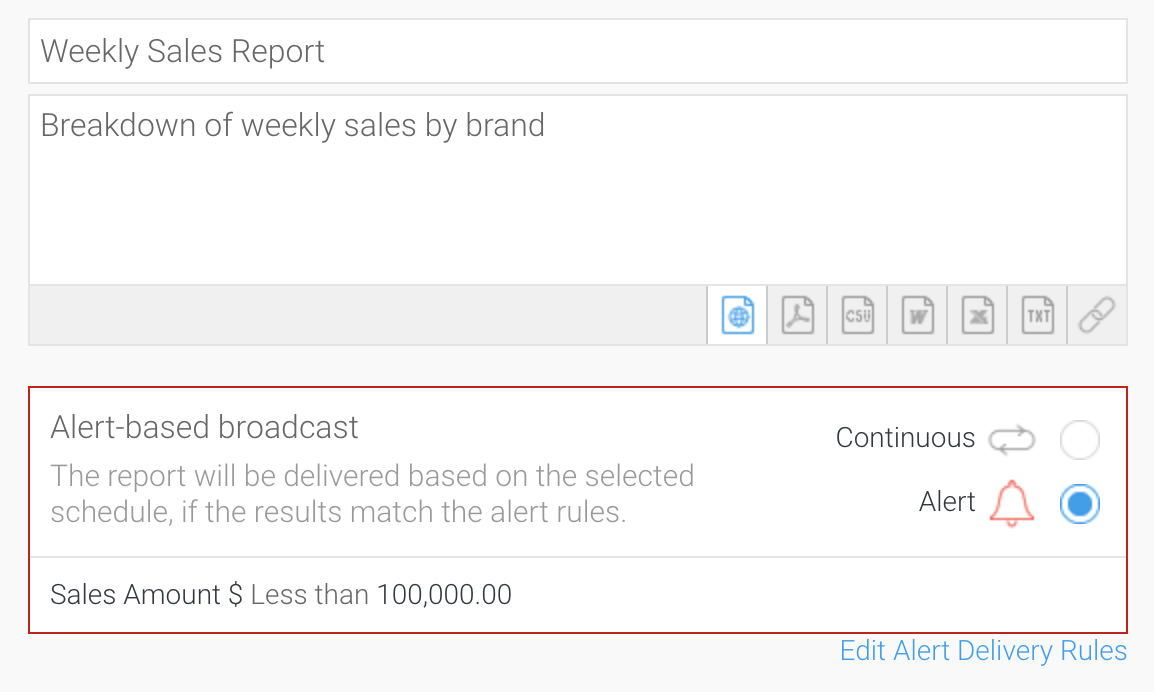
Individual reports can be scheduled to be run and distributed on a regular basis. Rules can be set against those reports which define when the report should be sent. This allows for example, reports to be sent on an exception basis – say when a particular metrics exceeds or falls below a predefined threshold. Rules can be set on the total value of a metric in a report, or triggered when any row in a report exceeds the threshold.

Further Reading: