

How to Influence the C-Suite with Data in 2026
Moving into 2024, many organizations want to amplify their use of data in the business to win over executives and line-of-business users alike to become more data-driven.
But in the age of information overload, simply presenting data is no longer enough. To impress today's data-driven executives and data-averse business users, you need to speak their language, anticipate their needs, and translate complex insights into actionable recommendations that directly impact the bottom line - and show them why the numbers matter. Data-driven leadership is important to encourage a data culture.
Here are 5 proven strategies to win the hearts (and minds) of the C-suite using your analytics in 2024, based on our conversations with global organizations and customers.
1. Become a Business Translator, Not Just a Data Interpreter
Executives care about results, not technical jargon. Ditch the obscure metrics and delve deeper to help the C-suite understand the business context and key performance indicators (KPIs) that drive decision-making. Frame your insights around their specific priorities, focusing on revenue growth, cost optimization, or market share expansion.
For example, instead of simply presenting churn rate, analyze the underlying trends, identify common customer pain points, and propose data-driven strategies to retain valuable customers.
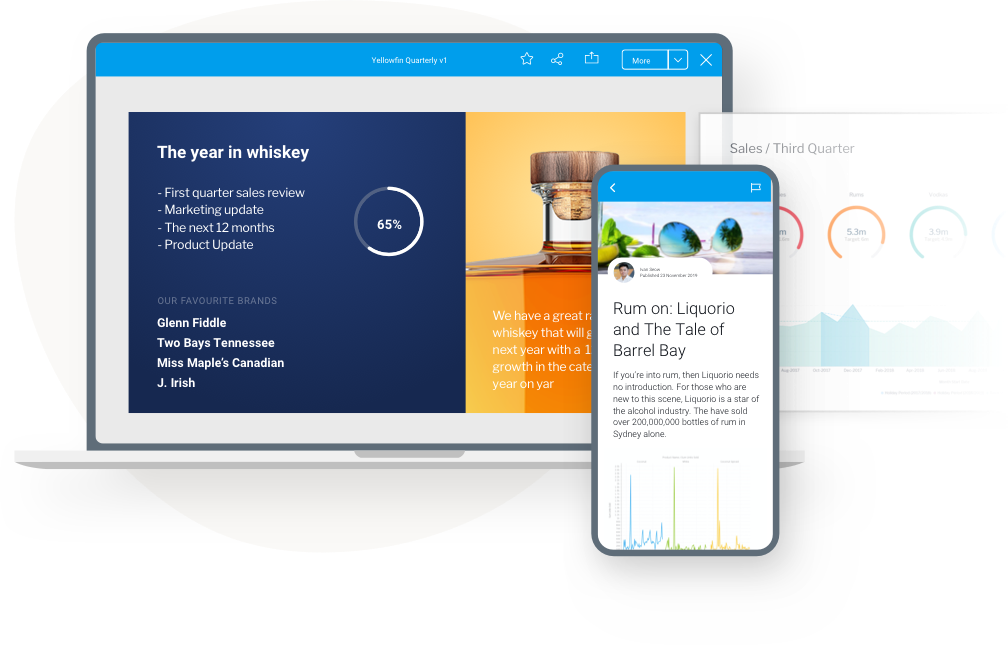 Certain business intelligence (BI) and analytics solutions are built from the ground up to help you present data in an interesting way while also revealing the context and ‘why behind the numbers. Yellowfin's drag-and-drop dashboard builder, for instance, empowers you to create visually compelling and informative dashboards that align with specific business objectives, and frame insights around KPIs that matter most to the C-suite both clearly and concisely.
Learn More: Yellowfin Dashboards
2. Quantify the ROI of Your Analytics Initiatives
Numbers speak volumes, especially to executives obsessed with return on investment (ROI). Don't just showcase cool dashboards; demonstrate the tangible financial impact of your data-driven efforts. Estimate the cost savings from process optimization, quantify the additional revenue generated by targeted marketing campaigns, and illustrate the improved customer satisfaction achieved through data-based personalization. By translating insights into clear financial terms, you'll earn their trust and secure support for future initiatives.
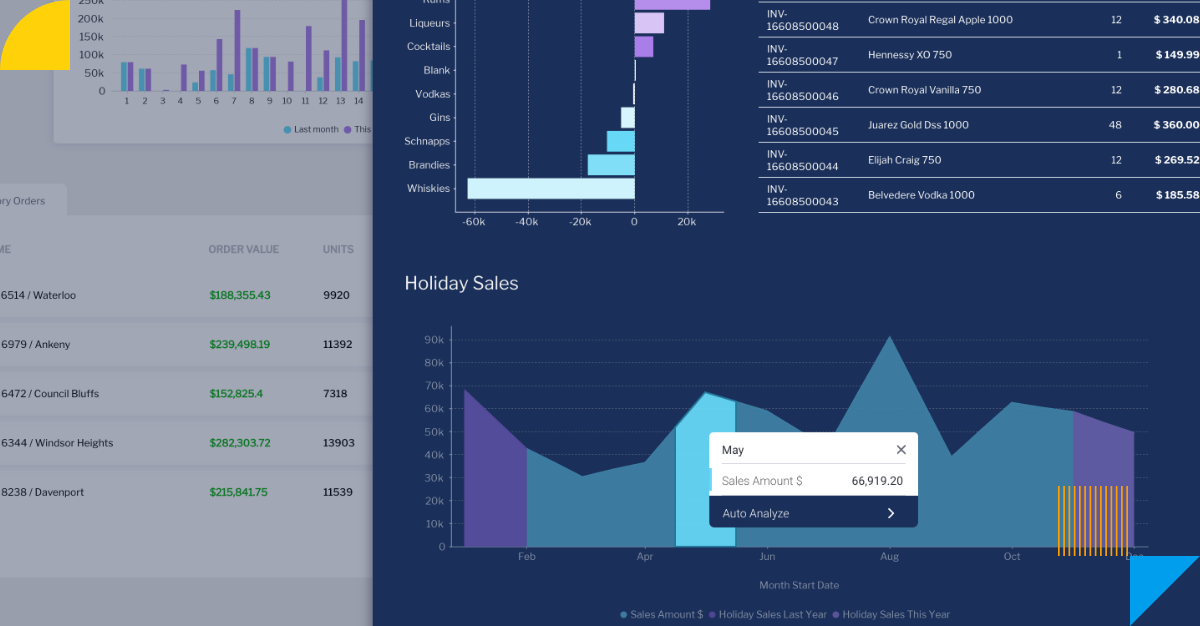
Not sure how to start distilling such deep insights from your large data-set? A good foundation and starting point can be achieved using Yellowfin BI’s built-in Assisted Insights feature, which uses automation, artificial intelligence (AI) and machine learning (ML) to analyze a particular data-set and then automatically generate a list of answers in the form of text and data visualizations (charts, graphs, etc) in natural language (no jargon or technical terms).
Not only can Assisted Insights help you better demonstrate, quantify and illustrate ROI faster and easier, but most importantly, it provides insights that your C-suite can immediately understand and point toward.
Read More: What is Yellowfin Assisted Insights? How to Get to the ‘Why’ Faster
3. Become a Proactive Problem Solver, Not a Passive Reporter
It’s important to move beyond simply reporting historical data or identifying existing problems. Analyze trends, anticipate potential risks and opportunities, and proactively suggest data-driven solutions to get both executives and line-of-business users more invested in using analytics as a method to drive decisions based on hard data, rather than just as a tool to monitor performance.
Develop predictive models to warn of future issues, forecast upcoming market shifts, and recommend preventative measures to avoid pitfalls. This proactive approach showcases your expertise and positions you as a strategic partner, not just a passive data supplier.
Several of Yellowfin's capabilities, including Signals, enable you to anticipate potential risks and opportunities, suggest proactive solutions, and forecast market trends using the power of automated business monitoring (ABM). These tools help you develop predictive models to warn of future issues, recommend preventative measures, and guide strategic decision-making.
See More: What is Yellowfin Signals?
4. Master the Art of Data Storytelling with Engaging Narratives
It’s 2024 - time to ditch the boring spreadsheets and static reports. Executives are bombarded with information everyday – to capture their attention, you have to ignite their interest with compelling data storytelling. Paint a clear picture of the problem, illustrate the potential impact of your recommendations, and guide them towards data-driven decisions with confidence.
Weaving data into captivating narratives, using visuals, case studies, and real-world examples to bring insights to life is no longer a nice-to-have, future-flung objective, but a must-have, especially when so many organizations today are moving toward using data storytelling. In fact, industry bodies like Gartner predict that data storytelling will be the most widespread means of consuming analytics by 2025.
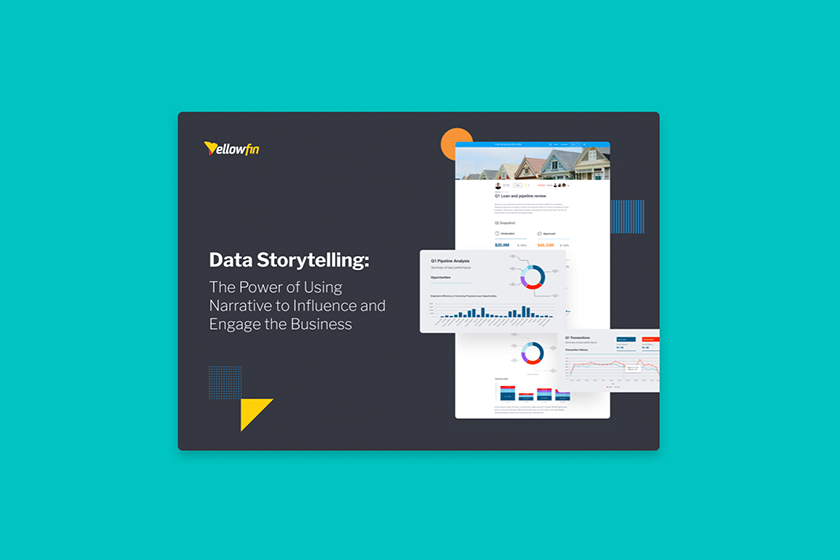
Download our free whitepaper on Data Storytelling for more information.
Yellowfin's data storytelling features, Stories and Present, let you create interactive blog-style stories and executive presentations, with guided navigation and annotations to weave narratives behind hard data (which can be integrated directly into the Story or Presentation you create) which brings the insights you’ve discovered to life.
Remember, context is key; showcase the potential impact of your recommendations and guide data-driven decisions with it at the forefront, and you'll get buy-in from C-suite.
Learn More: Yellowfin Data Storytelling - Stories and Present
5. Anticipate Their Questions and Pre-empt Potential Doubts
Executives are well-versed in their specific domains, and often come to the table with preconceived notions or skepticism. Address their concerns head-on by anticipating their questions and providing pre-emptive clarifications. Prepare counter-arguments to potential doubts, present alternative scenarios supported by data, and demonstrate the validity of your recommendations with thorough analysis. This proactive approach shows respect for their expertise and builds trust in your data-driven insights.
By mastering these strategies, you'll transform from a data analyst into a strategic partner, winning the hearts and minds of data-driven executives. Remember, you're not just presenting data; you're influencing decisions, shaping the future of the organization, and driving tangible results.

Embrace the challenge, hone your communication skills, and become a trusted advisor who helps your organization navigate the ever-evolving world of data-driven success.
Frequently Asked Questions About Influencing Executives with Data
How do you present data to executives effectively?
Executives usually want to know the business impact, not the technical details . The best presentations link data to strategic goals, identify key performance indicators (KPIs), and make clear how the insights affect revenue, costs, risk, or growth.
Why is data storytelling important for executives?
Storytelling with data helps turn complex analysis into clear, actionable insights. Organizations that use data, visuals, and business context can make interpreting information easier and improve decision-making among executives.
What metrics do executives care about most?
Executives commonly focus on metrics related to revenue growth, profitability, customer retention, operational efficiency, market share and return on investment (ROI), though priorities vary by organization.
How can business intelligence help executive decision-making?
Business intelligence tools empower executives to quickly understand what is happening, spot trends, track performance, and make intelligent decisions based on reliable data, not guesses or hunches.
What is executive buy-in for data analytics?
Executive buy-in occurs when senior leaders trust and actively use data to guide business decisions. Achieving buy-in often requires demonstrating clear business value, measurable ROI, and actionable recommendations supported by reliable data.
How do you demonstrate ROI from analytics initiatives?
Organizations can quantify ROI based on increases in revenue, cost savings, productivity, customer retention, risk mitigation or operational efficiency that can be attributed to data-driven decision-making and investments in business intelligence.
What makes a good executive dashboard?
A good executive dashboard focuses on high-priority KPIs, presents information clearly, provides business context, and enables leaders to quickly understand performance trends without being overwhelmed by unnecessary details.
How can organizations build a data-driven culture?
To build a data-driven culture, organizations need leadership buy-in, user-friendly analytics tools, data literacy training, well-defined performance metrics and encouragement for all employees to use data in decision-making.
What are the biggest challenges in executive reporting?
Common challenges include information overload, lack of context, inconsistent data sources, unclear visualizations and difficulty linking analytics to business outcomes that matter to decision-makers.
What is the difference between data visualization and data storytelling?
Data visualization is about presenting information through charts, graphs, and dashboards, while data storytelling adds narrative, context, and business meaning to help audiences understand why the data matters and what actions should be taken.
How Yellowfin can help unlock insights for executives
Yellowfin is a highly extensible, customizable and feature-rich business intelligence suite made for executives and business users alike. Learn more.