

Top Data and Analytics Trends and Benefits for 2026
2022 was without a doubt a landmark year for business intelligence (BI) and analytics. With continued development of innovative and sophisticated technologies such as contextual analytics, analysis of our business data is more accessible than ever before.
Many of these same trends will continue to grow into 2023, but the data analytics space is ever evolving. With global conditions creating uncertainty in areas of data security and training comes other emerging capabilities that look set to capture our attention.
Companies that wish to thrive and realize value at scale need to prepare and optimize for upcoming new value equations to enable a faster response than competitors. To help you plan ahead, this blog details the top 3 biggest data and analytics trends for 2023.
Not yet up-to-date? Catch up on the top 3 data and analytics trends for 2022.
 In 2023, self-service analytics continues its expansion in influence and priority as modern enterprises and independent software vendors recognize the need to democratize data access, with features such as drag and drop user interfaces for report building, low code, no code data preparation, flexible data connectivity via connectors, and augmented analytics capability that helps streamline and guide the analysis process for beginners.
By the end of this year, overall analytics adoption is expected to increase from 35% to 50%, driven by vertical-and-domain-specific self-service solutions using the automated processes made possible by augmented analytics, according to Gartner.
Read More: 5 Steps to Prepare for Enterprise Self-Service Analytics
In 2023, self-service analytics continues its expansion in influence and priority as modern enterprises and independent software vendors recognize the need to democratize data access, with features such as drag and drop user interfaces for report building, low code, no code data preparation, flexible data connectivity via connectors, and augmented analytics capability that helps streamline and guide the analysis process for beginners.
By the end of this year, overall analytics adoption is expected to increase from 35% to 50%, driven by vertical-and-domain-specific self-service solutions using the automated processes made possible by augmented analytics, according to Gartner.
Read More: 5 Steps to Prepare for Enterprise Self-Service Analytics
 The technologies that come under the field of augmented analytics has seen a steady increase in interest and investment over the past five years, but in 2023 and beyond it is set to explode in adoption rate, with approximately 9 in ten analytics processes expected to be enhanced by AI and ML tech to streamline operations and increase the value that can be derived from data, and one-third of organizations set to replace legacy BI tools with platforms that utilize natural language as a method to inform and guide business professionals, according to Ventana Research.
Not everyone is able to hit the ground running when presented with a dashboard or data visualization solution - they may not understand the data presented, or even how to use the tool to explore it. What augmented analytics does is make this entire process a lot less technical and far more streamlined for the average user, using AI and ML to, for instance, make suggestions for what filtering should be applied to a data question or automatically alert the user to changes in a report, and generates visualizations, explanations and comparisons as part of the guided analysis process, which can then be leveraged by the user to form the basis of a dashboard.
The technologies that come under the field of augmented analytics has seen a steady increase in interest and investment over the past five years, but in 2023 and beyond it is set to explode in adoption rate, with approximately 9 in ten analytics processes expected to be enhanced by AI and ML tech to streamline operations and increase the value that can be derived from data, and one-third of organizations set to replace legacy BI tools with platforms that utilize natural language as a method to inform and guide business professionals, according to Ventana Research.
Not everyone is able to hit the ground running when presented with a dashboard or data visualization solution - they may not understand the data presented, or even how to use the tool to explore it. What augmented analytics does is make this entire process a lot less technical and far more streamlined for the average user, using AI and ML to, for instance, make suggestions for what filtering should be applied to a data question or automatically alert the user to changes in a report, and generates visualizations, explanations and comparisons as part of the guided analysis process, which can then be leveraged by the user to form the basis of a dashboard.
 For example, Yellowfin Assisted Insights use AI and ML to generate a helpful text-based explanation or comparison accompanied by a data visualization to assist the user in understanding the meaning of a particular data-point in a dashboard, while Yellowfin Signals uses automated business monitoring technology) to automatically monitor, track and alert an analytics end-user on when major trends are detected, helping lead them to potential insights. Yellowfin Guided NLQ goes a step further and uses natural language query and machine learning technologies to proactively assist a user in asking a specific question of their data by automatically generating suggestions for filtering as they type in their initial query.
While augmented analytics is primarily focused on democratizing access to data analysis tools for non-technical people, it also has the added benefit of increasing the efficiency of the analysis process for advanced users too, such as data analysts or developers.
Data governance is taking center stage in 2023 for several reasons. The growing adoption of self-service analytics has put more pressure on organizations to ensure data they are providing to everyday BI users is trustworthy and reliable for analysis and insight discovery. The complexity and vastness of data today means current truth-based approaches (i.e. yes/no) are no longer sufficient to establish trustworthiness of the information being used for decision-making.
In addition, there is a rapidly increasing expectation for a clear line-of-sight between the data stored in a data warehouse or dashboard and its impact upon potential business decisions or outcomes; that requires increased transparency and accountability over the auditing and management of that data. According to a Gartner report, only 44% of organizations agreed that accountability and decision rights in regards to governance efforts were clear in their business.
Finally, with stricter third-party and regulatory compliance requirements around data security, data privacy and data quality, management of permissions over data has led to greater scrutiny and awareness over data governance’s importance.
Ultimately, no amount of investment into the latest analytics tool or technology will stand up to scrutiny without proper implementation of data governance through the analytics pipeline. This is why data governance is hugely important to focus to improve analytics usability in 2023.
Read More: Data Security and Compliance - 5 Essential Considerations
For example, Yellowfin Assisted Insights use AI and ML to generate a helpful text-based explanation or comparison accompanied by a data visualization to assist the user in understanding the meaning of a particular data-point in a dashboard, while Yellowfin Signals uses automated business monitoring technology) to automatically monitor, track and alert an analytics end-user on when major trends are detected, helping lead them to potential insights. Yellowfin Guided NLQ goes a step further and uses natural language query and machine learning technologies to proactively assist a user in asking a specific question of their data by automatically generating suggestions for filtering as they type in their initial query.
While augmented analytics is primarily focused on democratizing access to data analysis tools for non-technical people, it also has the added benefit of increasing the efficiency of the analysis process for advanced users too, such as data analysts or developers.
Data governance is taking center stage in 2023 for several reasons. The growing adoption of self-service analytics has put more pressure on organizations to ensure data they are providing to everyday BI users is trustworthy and reliable for analysis and insight discovery. The complexity and vastness of data today means current truth-based approaches (i.e. yes/no) are no longer sufficient to establish trustworthiness of the information being used for decision-making.
In addition, there is a rapidly increasing expectation for a clear line-of-sight between the data stored in a data warehouse or dashboard and its impact upon potential business decisions or outcomes; that requires increased transparency and accountability over the auditing and management of that data. According to a Gartner report, only 44% of organizations agreed that accountability and decision rights in regards to governance efforts were clear in their business.
Finally, with stricter third-party and regulatory compliance requirements around data security, data privacy and data quality, management of permissions over data has led to greater scrutiny and awareness over data governance’s importance.
Ultimately, no amount of investment into the latest analytics tool or technology will stand up to scrutiny without proper implementation of data governance through the analytics pipeline. This is why data governance is hugely important to focus to improve analytics usability in 2023.
Read More: Data Security and Compliance - 5 Essential Considerations
Blog Contents
hide
Trend #1 - Self-Service Analytics
Self-service analytics is a form of BI that focuses on opening up the ability to consume, analyze and share data to everyone, regardless of their technical or data knowledge. A self-service BI solution is one that line-of-business people and advanced analysts alike can use effectively - compared to traditional, legacy BI tools which are typically inaccessible to regular users, who must rely on IT to build reports or answer data requests for them. Because there has been a rapid increase in the need for data-driven insights and more awareness of the benefits of a data-driven work culture, self-service analytics has grown to become one of the biggest trends in BI in the past few years.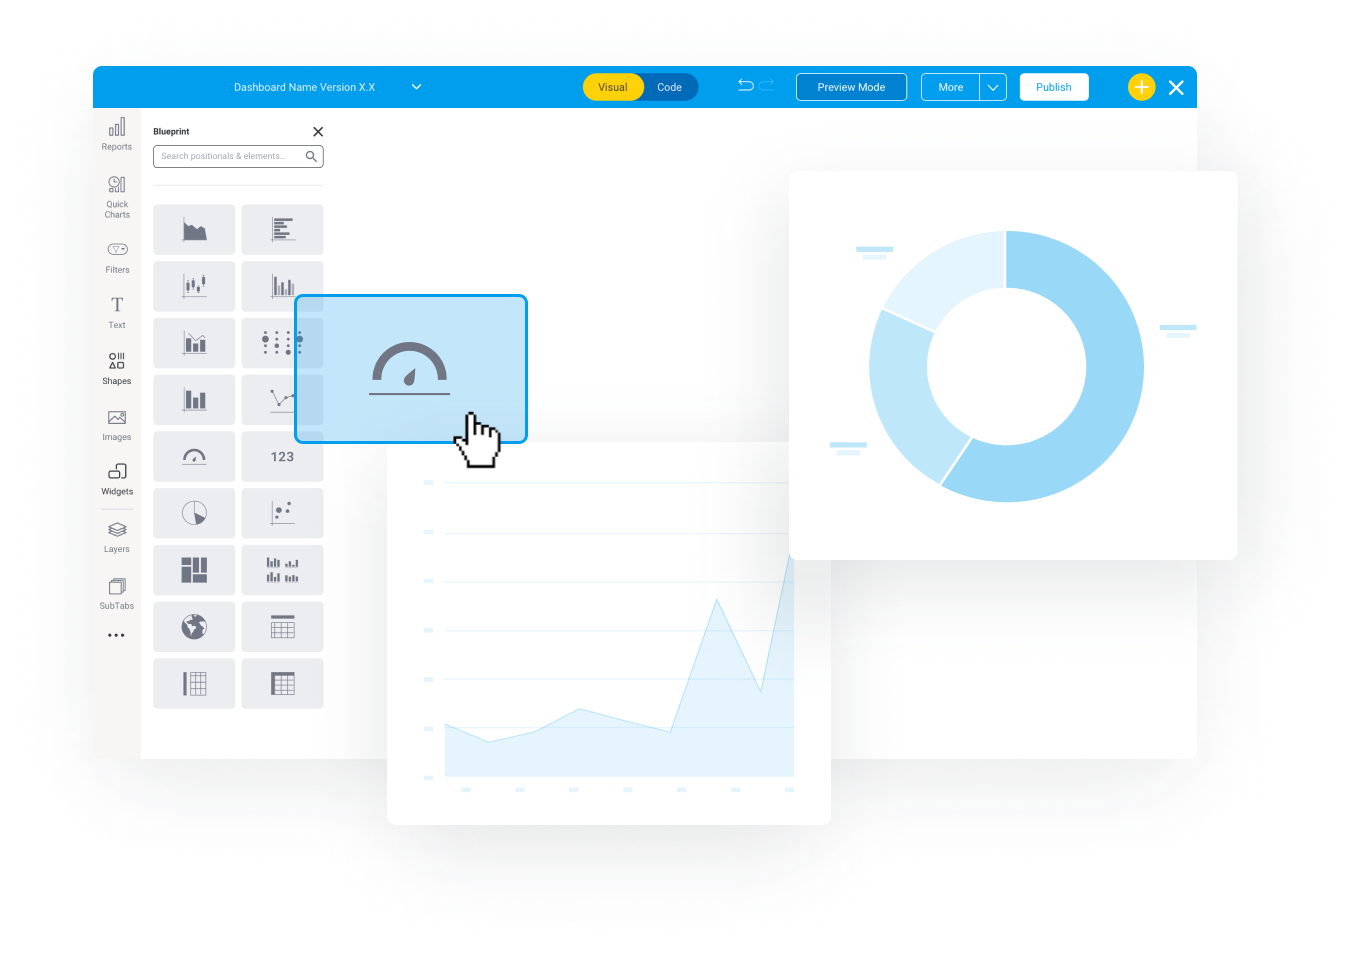 In 2023, self-service analytics continues its expansion in influence and priority as modern enterprises and independent software vendors recognize the need to democratize data access, with features such as drag and drop user interfaces for report building, low code, no code data preparation, flexible data connectivity via connectors, and augmented analytics capability that helps streamline and guide the analysis process for beginners.
By the end of this year, overall analytics adoption is expected to increase from 35% to 50%, driven by vertical-and-domain-specific self-service solutions using the automated processes made possible by augmented analytics, according to Gartner.
Read More: 5 Steps to Prepare for Enterprise Self-Service Analytics
In 2023, self-service analytics continues its expansion in influence and priority as modern enterprises and independent software vendors recognize the need to democratize data access, with features such as drag and drop user interfaces for report building, low code, no code data preparation, flexible data connectivity via connectors, and augmented analytics capability that helps streamline and guide the analysis process for beginners.
By the end of this year, overall analytics adoption is expected to increase from 35% to 50%, driven by vertical-and-domain-specific self-service solutions using the automated processes made possible by augmented analytics, according to Gartner.
Read More: 5 Steps to Prepare for Enterprise Self-Service Analytics
Trend #2 - Augmented analytics
Augmented analytics is the deep integration of sophisticated technologies such as automated business monitoring, artificial intelligence (AI), machine learning (ML) and natural language query (NLQ) intended to make BI tools such as dashboards and data visualization easier to use and more intuitive for line-of-business users. BI software vendors that incorporate augmented analytics help reduce the need for specific skill-sets in order to benefit from AI or ML in data analysis, while guiding the user on how to examine data using automated processes - and it's fast becoming mainstream. The technologies that come under the field of augmented analytics has seen a steady increase in interest and investment over the past five years, but in 2023 and beyond it is set to explode in adoption rate, with approximately 9 in ten analytics processes expected to be enhanced by AI and ML tech to streamline operations and increase the value that can be derived from data, and one-third of organizations set to replace legacy BI tools with platforms that utilize natural language as a method to inform and guide business professionals, according to Ventana Research.
Not everyone is able to hit the ground running when presented with a dashboard or data visualization solution - they may not understand the data presented, or even how to use the tool to explore it. What augmented analytics does is make this entire process a lot less technical and far more streamlined for the average user, using AI and ML to, for instance, make suggestions for what filtering should be applied to a data question or automatically alert the user to changes in a report, and generates visualizations, explanations and comparisons as part of the guided analysis process, which can then be leveraged by the user to form the basis of a dashboard.
The technologies that come under the field of augmented analytics has seen a steady increase in interest and investment over the past five years, but in 2023 and beyond it is set to explode in adoption rate, with approximately 9 in ten analytics processes expected to be enhanced by AI and ML tech to streamline operations and increase the value that can be derived from data, and one-third of organizations set to replace legacy BI tools with platforms that utilize natural language as a method to inform and guide business professionals, according to Ventana Research.
Not everyone is able to hit the ground running when presented with a dashboard or data visualization solution - they may not understand the data presented, or even how to use the tool to explore it. What augmented analytics does is make this entire process a lot less technical and far more streamlined for the average user, using AI and ML to, for instance, make suggestions for what filtering should be applied to a data question or automatically alert the user to changes in a report, and generates visualizations, explanations and comparisons as part of the guided analysis process, which can then be leveraged by the user to form the basis of a dashboard.
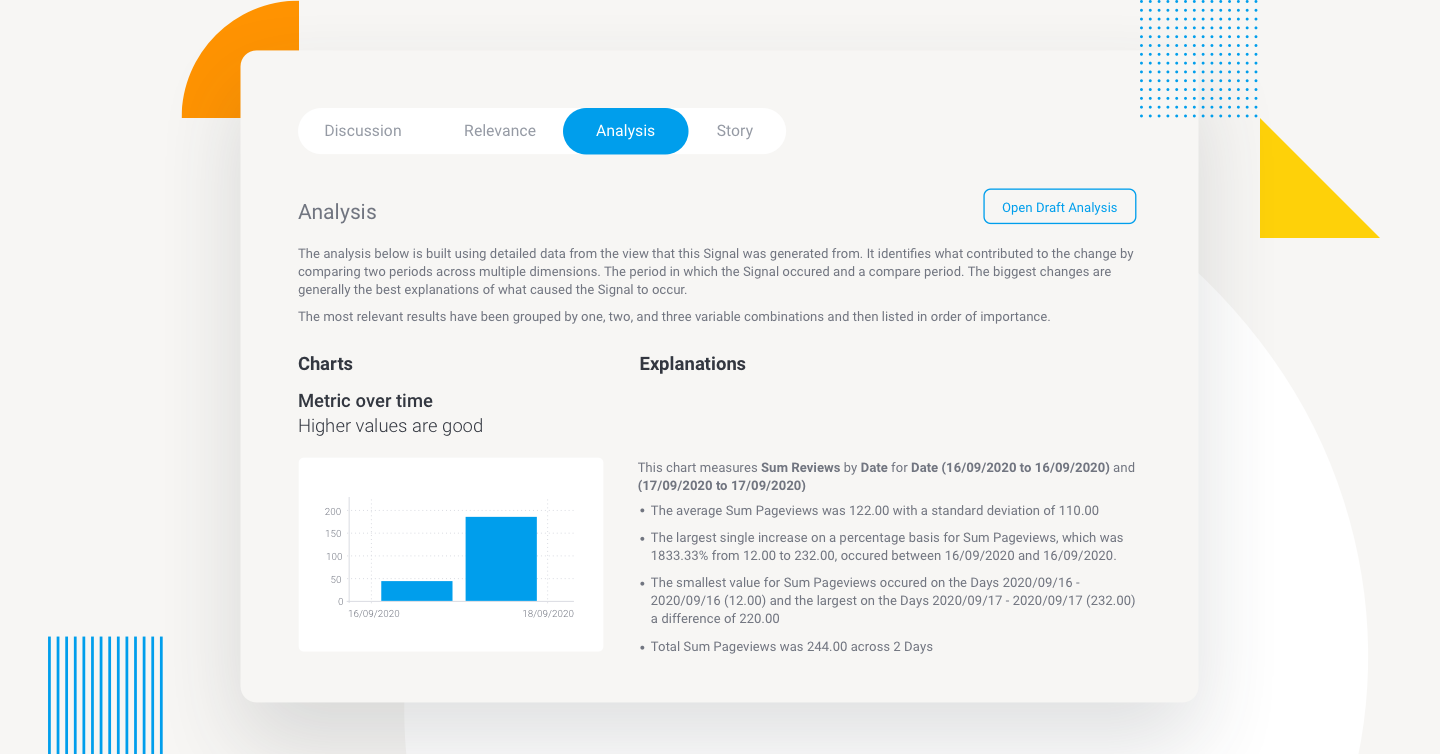 For example, Yellowfin Assisted Insights use AI and ML to generate a helpful text-based explanation or comparison accompanied by a data visualization to assist the user in understanding the meaning of a particular data-point in a dashboard, while Yellowfin Signals uses automated business monitoring technology) to automatically monitor, track and alert an analytics end-user on when major trends are detected, helping lead them to potential insights. Yellowfin Guided NLQ goes a step further and uses natural language query and machine learning technologies to proactively assist a user in asking a specific question of their data by automatically generating suggestions for filtering as they type in their initial query.
While augmented analytics is primarily focused on democratizing access to data analysis tools for non-technical people, it also has the added benefit of increasing the efficiency of the analysis process for advanced users too, such as data analysts or developers.
For example, Yellowfin Assisted Insights use AI and ML to generate a helpful text-based explanation or comparison accompanied by a data visualization to assist the user in understanding the meaning of a particular data-point in a dashboard, while Yellowfin Signals uses automated business monitoring technology) to automatically monitor, track and alert an analytics end-user on when major trends are detected, helping lead them to potential insights. Yellowfin Guided NLQ goes a step further and uses natural language query and machine learning technologies to proactively assist a user in asking a specific question of their data by automatically generating suggestions for filtering as they type in their initial query.
While augmented analytics is primarily focused on democratizing access to data analysis tools for non-technical people, it also has the added benefit of increasing the efficiency of the analysis process for advanced users too, such as data analysts or developers.
Trend #3 - Data Governance
Data governance describes the official policies and processes that organizations put in place to enforce tight control, compliance and management over their sensitive data assets. It also describes the in-built tools of a BI solution that allows organizations to execute and enforce their governance and compliance requirements directly within their analytics implementation. What data governance policies and frameworks help ensure is the trustworthiness, availability and usability of data through its lifecycle - starting from connecting to a data source, to building a report, analyzing a dashboard, sharing analysis findings, and so on.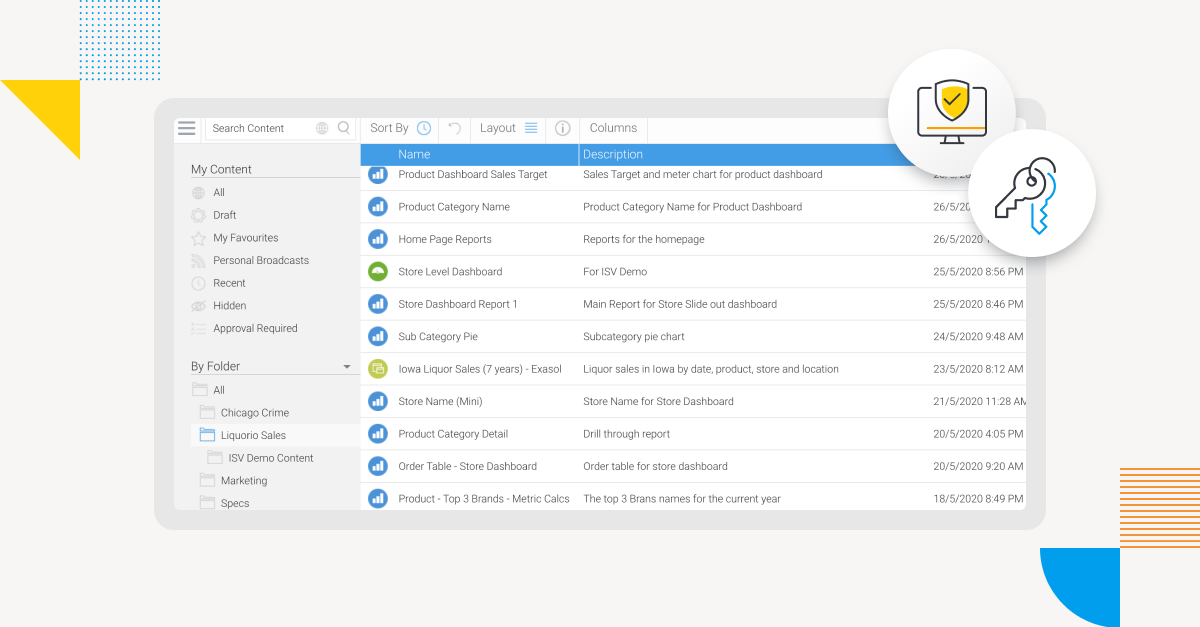 Data governance is taking center stage in 2023 for several reasons. The growing adoption of self-service analytics has put more pressure on organizations to ensure data they are providing to everyday BI users is trustworthy and reliable for analysis and insight discovery. The complexity and vastness of data today means current truth-based approaches (i.e. yes/no) are no longer sufficient to establish trustworthiness of the information being used for decision-making.
In addition, there is a rapidly increasing expectation for a clear line-of-sight between the data stored in a data warehouse or dashboard and its impact upon potential business decisions or outcomes; that requires increased transparency and accountability over the auditing and management of that data. According to a Gartner report, only 44% of organizations agreed that accountability and decision rights in regards to governance efforts were clear in their business.
Finally, with stricter third-party and regulatory compliance requirements around data security, data privacy and data quality, management of permissions over data has led to greater scrutiny and awareness over data governance’s importance.
Ultimately, no amount of investment into the latest analytics tool or technology will stand up to scrutiny without proper implementation of data governance through the analytics pipeline. This is why data governance is hugely important to focus to improve analytics usability in 2023.
Read More: Data Security and Compliance - 5 Essential Considerations
Data governance is taking center stage in 2023 for several reasons. The growing adoption of self-service analytics has put more pressure on organizations to ensure data they are providing to everyday BI users is trustworthy and reliable for analysis and insight discovery. The complexity and vastness of data today means current truth-based approaches (i.e. yes/no) are no longer sufficient to establish trustworthiness of the information being used for decision-making.
In addition, there is a rapidly increasing expectation for a clear line-of-sight between the data stored in a data warehouse or dashboard and its impact upon potential business decisions or outcomes; that requires increased transparency and accountability over the auditing and management of that data. According to a Gartner report, only 44% of organizations agreed that accountability and decision rights in regards to governance efforts were clear in their business.
Finally, with stricter third-party and regulatory compliance requirements around data security, data privacy and data quality, management of permissions over data has led to greater scrutiny and awareness over data governance’s importance.
Ultimately, no amount of investment into the latest analytics tool or technology will stand up to scrutiny without proper implementation of data governance through the analytics pipeline. This is why data governance is hugely important to focus to improve analytics usability in 2023.
Read More: Data Security and Compliance - 5 Essential Considerations