Best Practice Guide
The ultimate step-by-step guide for analytic content creators.
General layouts for an effective experience
-
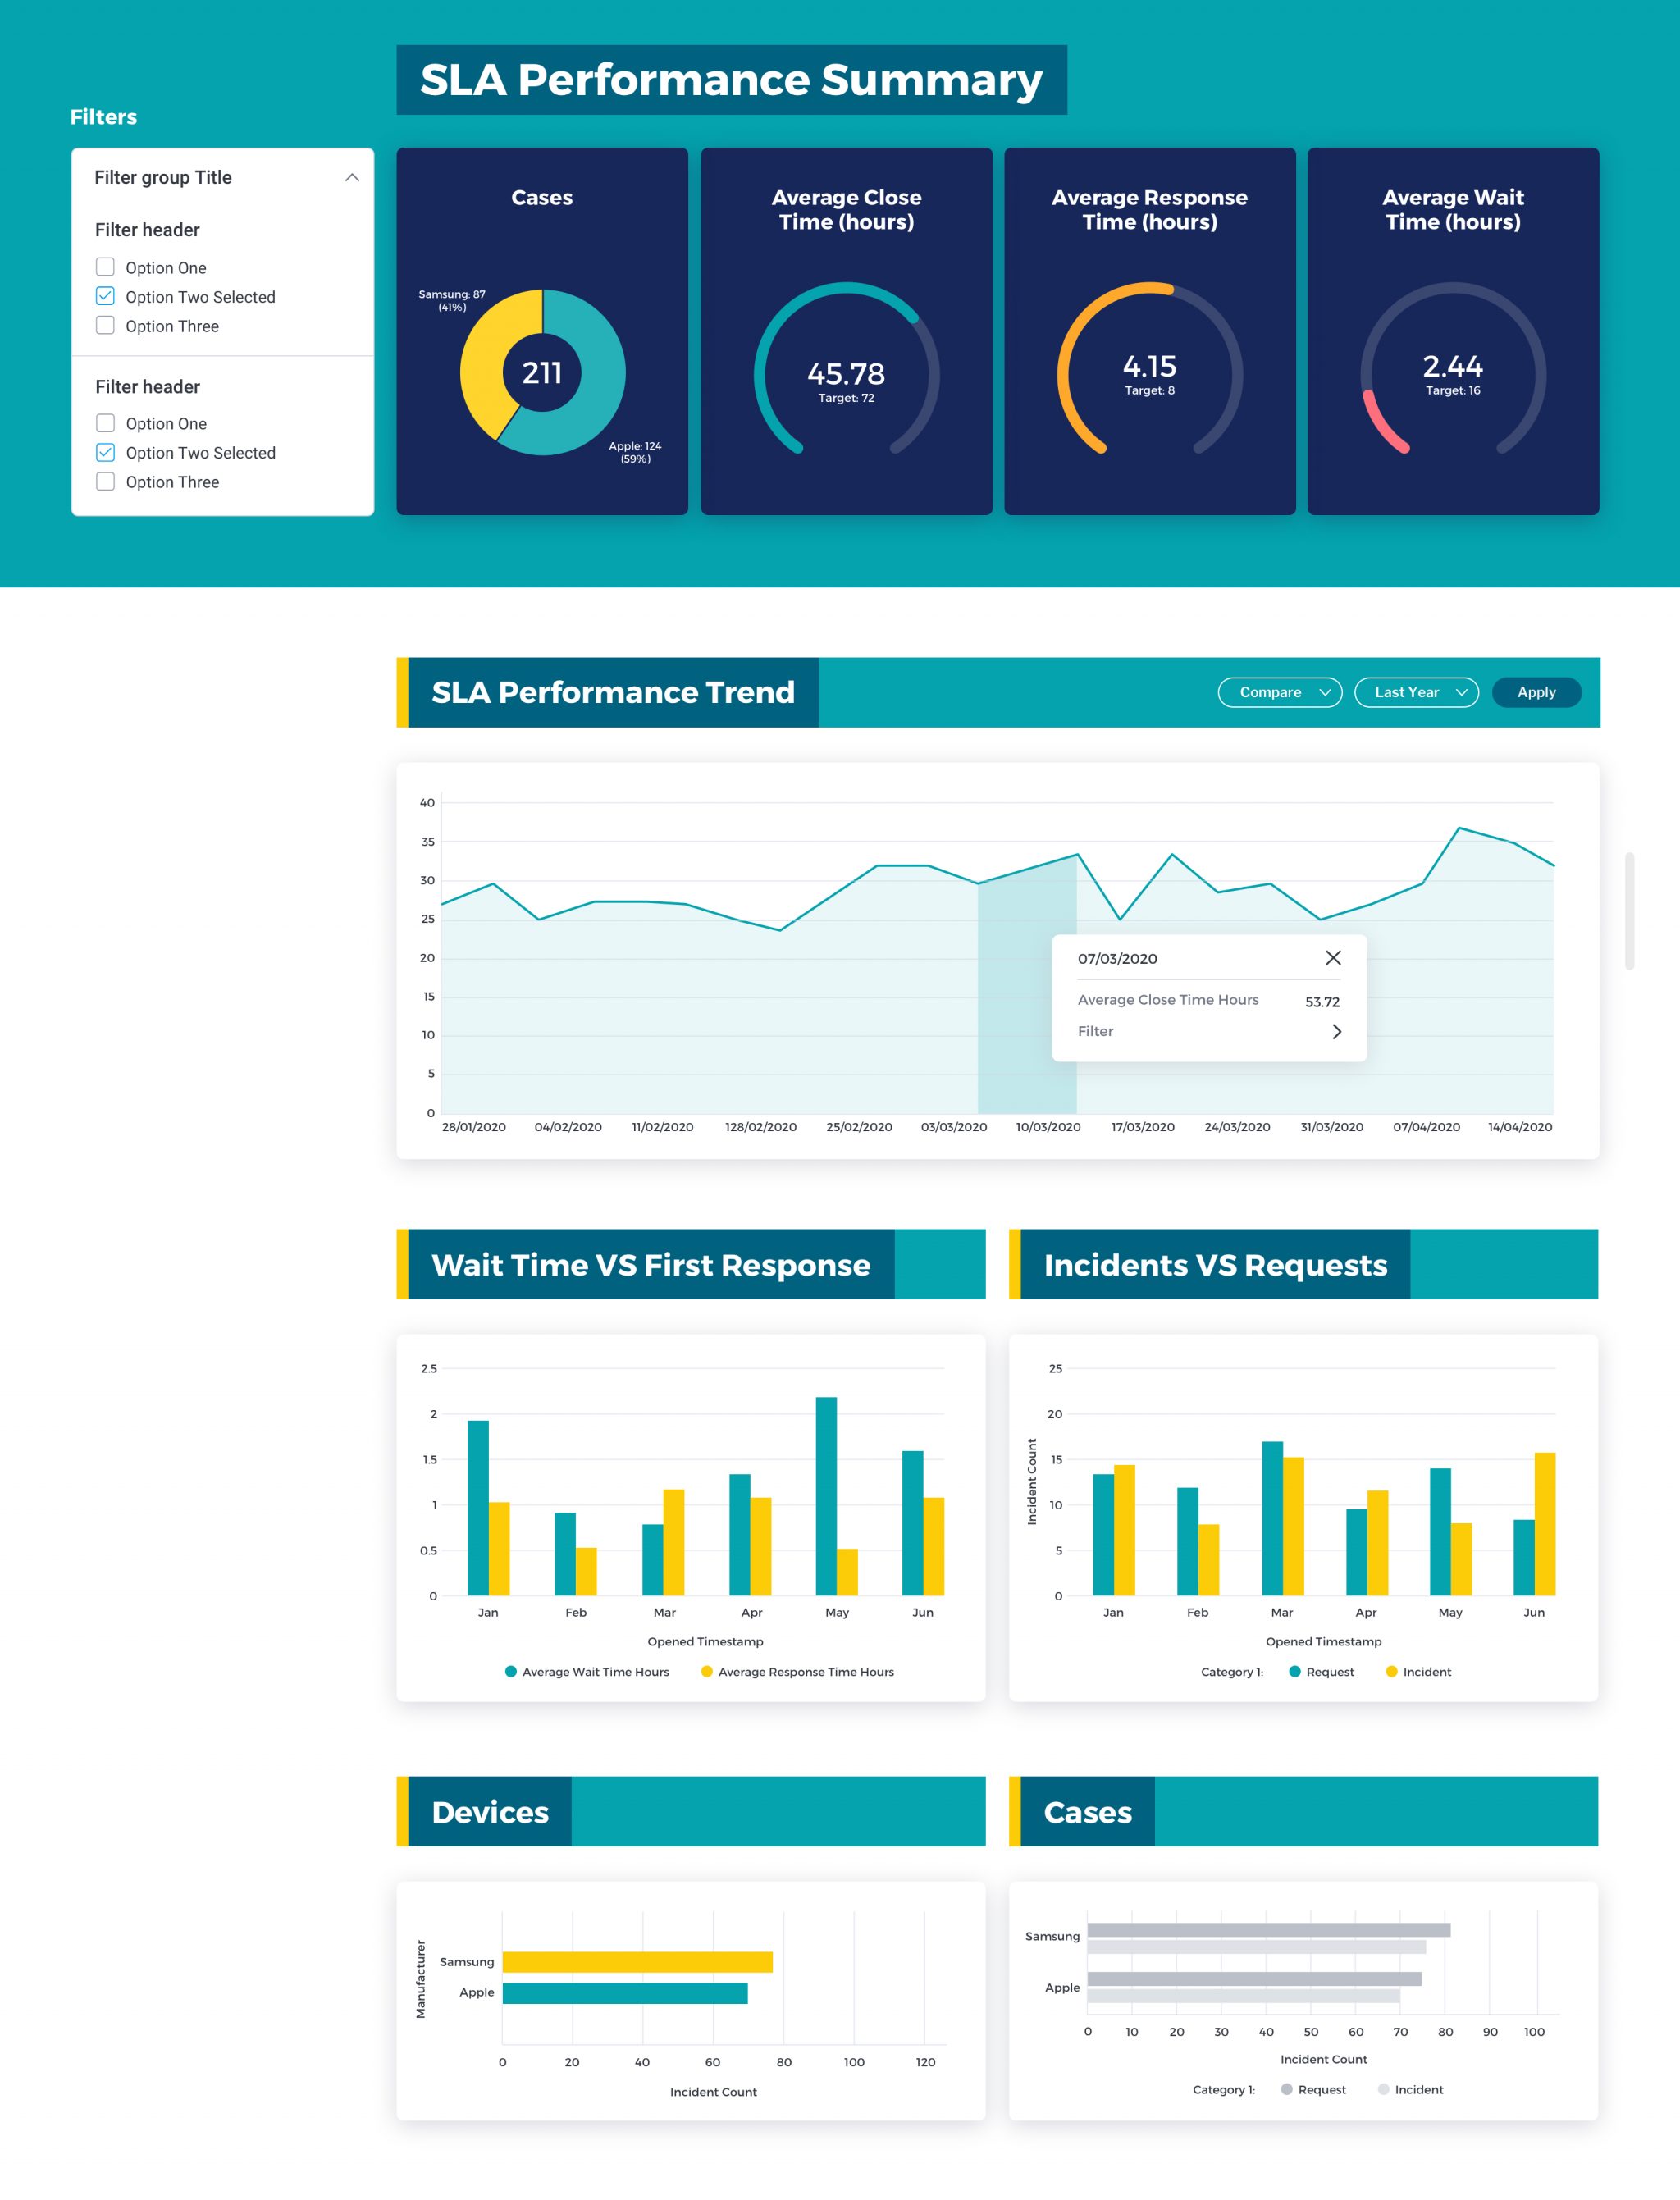
Strategic Dashboard Layout
Provide a very quick insight into performance.
- Monitoring and benchmarking the overall business, or a specific functional or operational area
- Aggregated key performance metrics compared to budget or previous periods
- A breakdown of performance by key business verticals
A strategic dashboard will tend to have charts that consolidate and aggregate activity and provide a top-level summary, such as KPI dials, yearly trends and comparisons. Aimed to deliver the user an indication of tracking against strategic business goals, without going into specific operational metrics at a granular level. The intent is usually to lead the users at key reporting periods through a journey that starts with overall performance metrics fundamental to success and then often delivers a suite of comparison metrics to allow for some very top-level analysis and context.
-
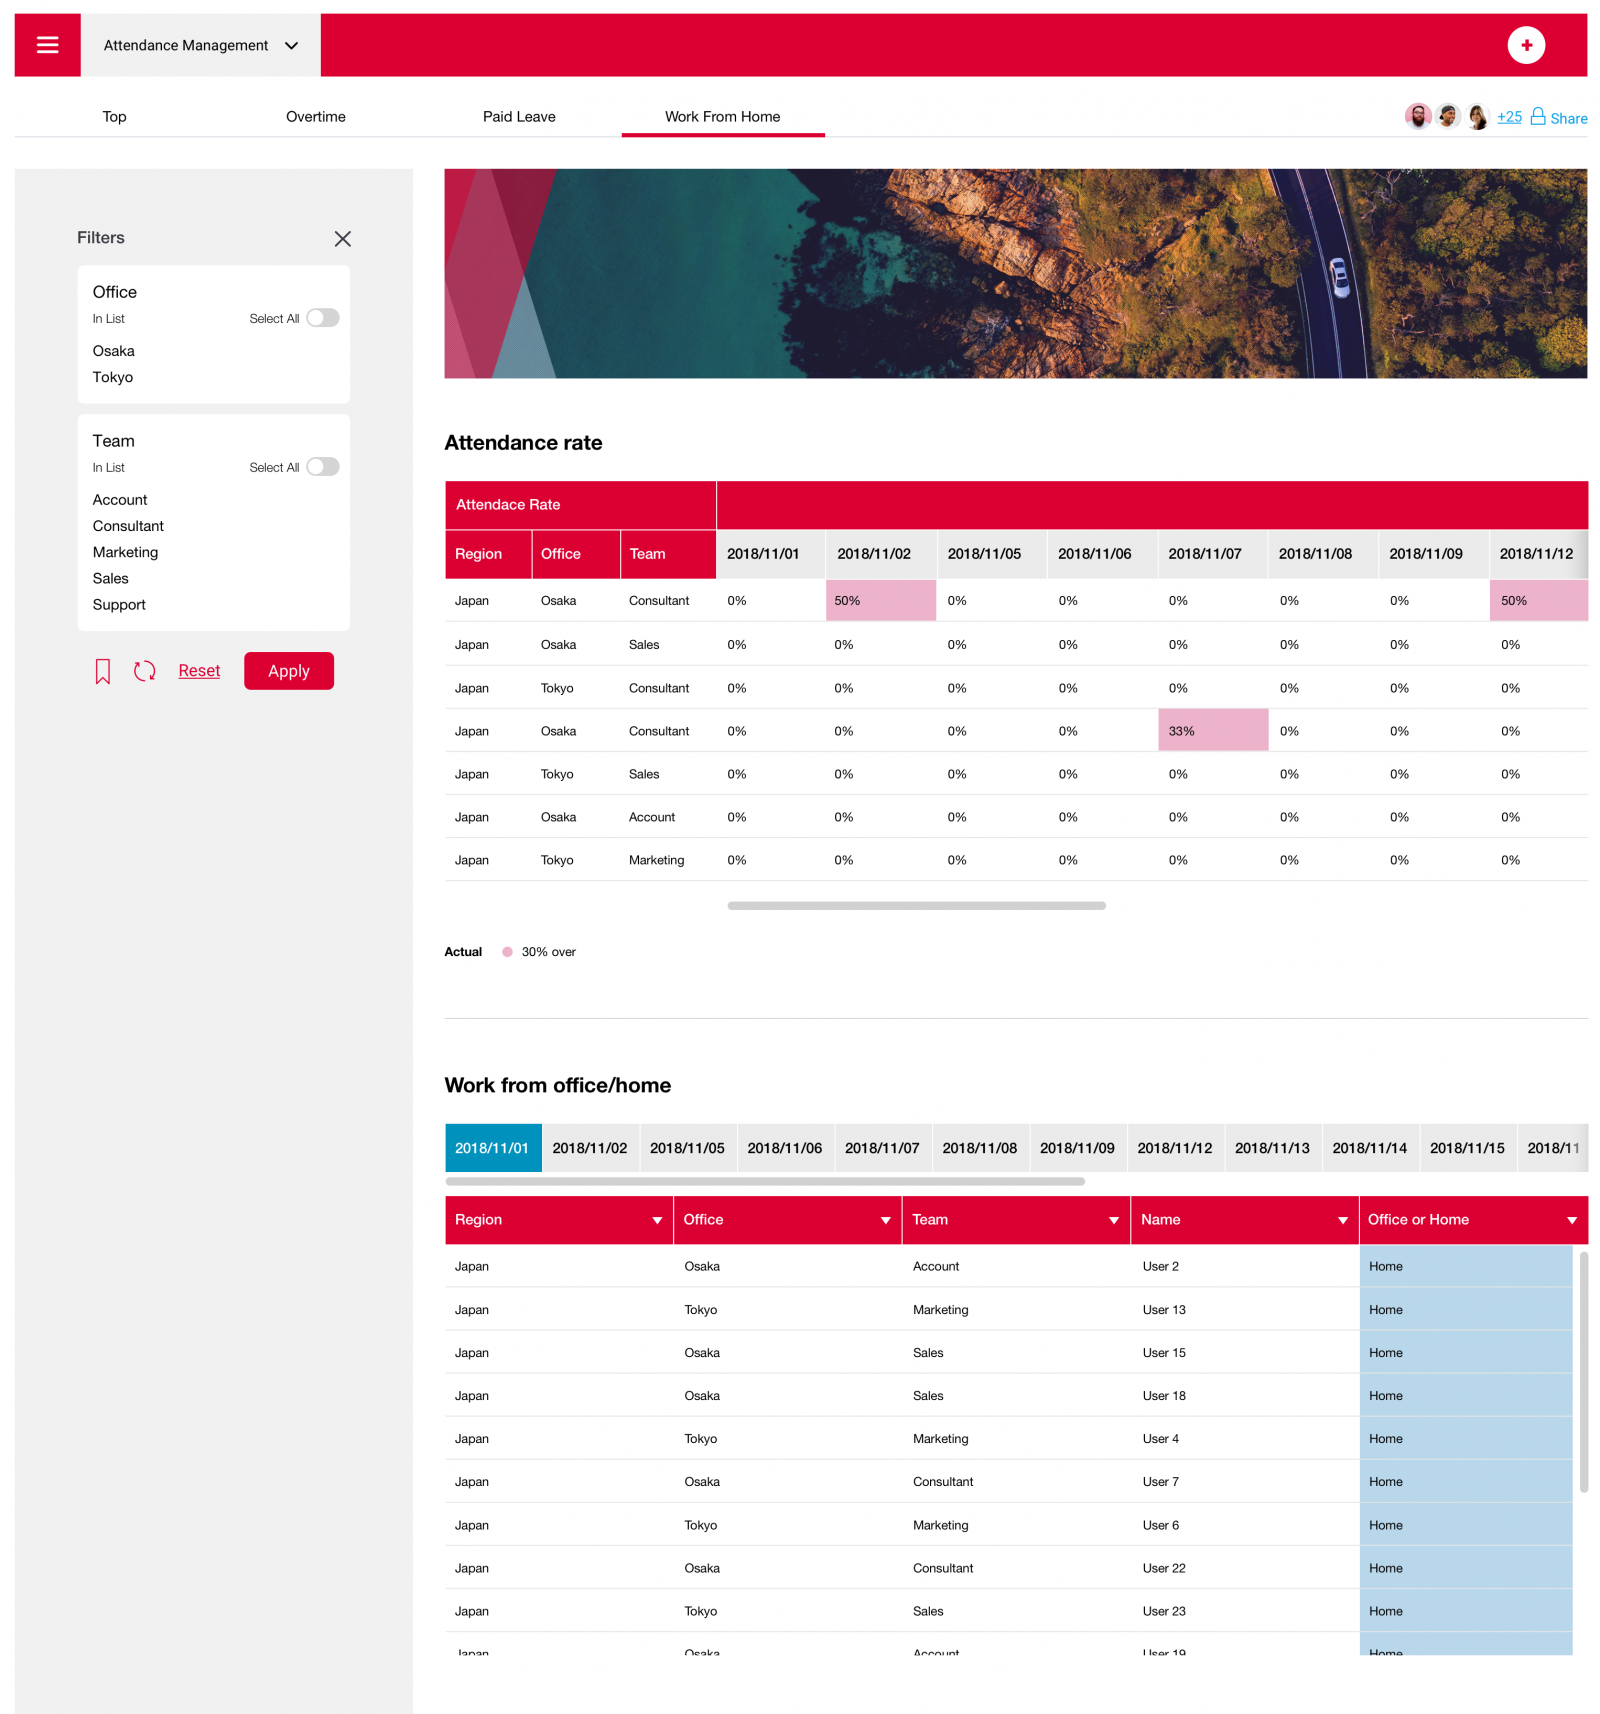
Operational Dashboard Layout
Manage the day-to-day operations of the business.
- Transactional decision-making and as such tend to be very subject area-specific
- Real-time picture of what is happening right now in that part of the business
- Designed with decision making in mind as such they may contain a lot of detail
- Design and structure needs to take this into account and guide the user
Operational dashboards allow more detailed data analysis at an operational level. This will ensure any insights are detected before impacting a more strategic, consolidated dashboard. Containing visualizations such as tables and charts allow users to view data at a more transactional level to help identify outliers or changes that may have an impact.

-
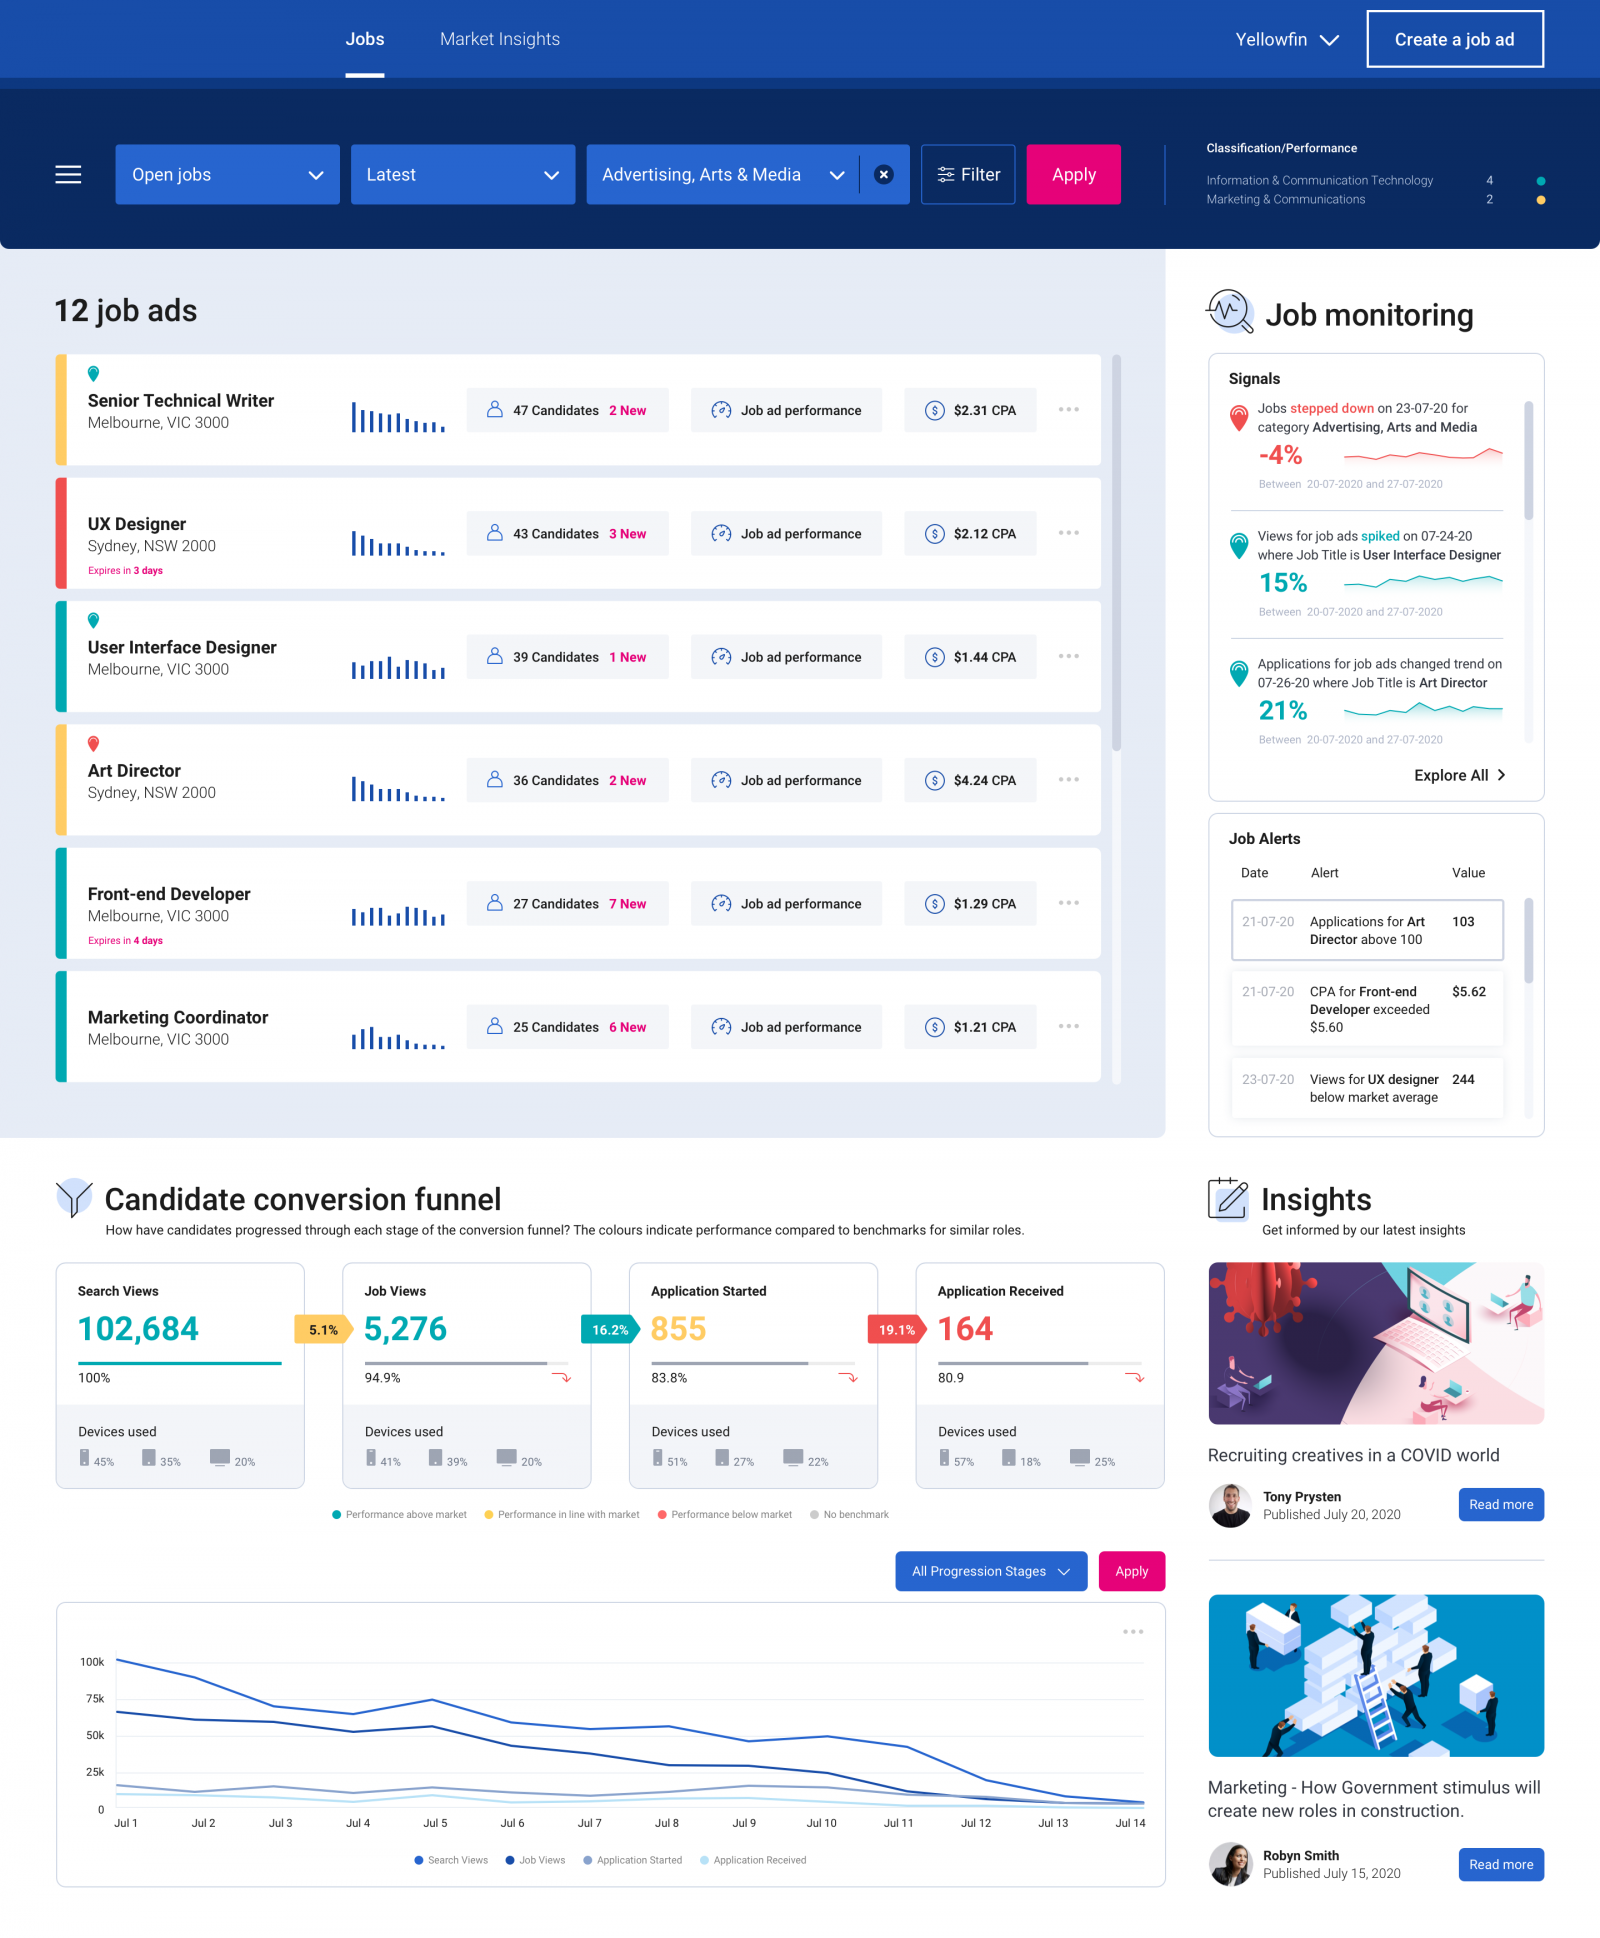
Contextual Dashboard Layout
A form of operational dashboard tightly embedded into 3rd party applications.
- Support or trigger workflows and transactions. Unlike a typical dashboard, where the end
- Accessed and filtered dynamically based on the actions of the user within the 3rd party software
- User experience and design support transactional workflows
A contextual dashboard may not in appearance look like a traditional dashboard. Analytic content is instead dispersed amongst key product pages to enable the user to see ‘contextual’ data relevant to key application workflows. This then saves the user from having to navigate to separate specific analytic areas of an application (or leave the application altogether) in order to gain the insights needed to make decisions and take action.